- Torreira Rates Osimhen Top as Butt Urges Man United Move
- Zenke Hails Nigerian Debutants After Super Eagles’ Victory Over Iran
- Eagles Cap Thrills Fernandez Following Nigeria Debut
- Adams and Okoye Hand Coach Chelle Selection Dilemma Following Iran Victory
- At 74, Tinubu Commits Salaries To New Armed Forces Support Fund
- Political Earthquake: Kwankwaso Leaves NNPP
- Bundesliga Trio Chase Super Eagles Top Scorer Paul Onuachu
- PDP Still Alive, Will Bounce Back-Wike
- Right of Reply: ADC: Bolaji Abdullahi – Stop Playing the Ostrich. Under Tinubu Nigeria’s Path to Recovery is indisputable
- Nigeria Launches Digital Platform to Improve Patient Care
- Lagos Begins Statewide Hospital Audits for Mandatory Health Insurance
- Experts Warn Nigeria’s Fragmented Healthcare is Failing Millions
- FCT Celebrates 94% TB Treatment Success Rate Amid National Detection Surge
- Medical Lab Scientists Warn New Reform Bills Could Cripple Nigerian Healthcare
- Allies Hail Tinubu at 74, Praise His Vision, Courage and Bold Leadership
- Oluremi Tinubu Prays for Husband, President Tinubu on 74th Birthday
- Tinubu Marks 74th Birthday, Thanks Nigerians for Support Amid Reforms
- Tinubu at 74: Ex-Spokesman Ngelale Reflects on President’s Leadership, Mentorship
- 2027: Renewed Hope Ambassadors mobilize grassroot support for Tinubu’s re-election bid
- Zamfara Governor Attends Coventry University Governance Workshop
- Disu Confers AIG Rank on Jimoh Moshood Olohundare
- Shock as Tiger Woods Suffers Car Accident
- INEC Moves Membership Register Submission to May 10
- Slavery Called Humanity’s Darkest Crime as U.S. Justifies Position
- First Lady, US Envoy Align on Future-Focused Collaboration
- Shettima Pushes Global Standards for Made-in-Nigeria Products
- Para Games: Dare, Dikko, Olopade to Lead Opening Ceremony
- Nigeria Wheelchair Women’s Basketball to Debut at Commonwealth Games 2026
- Oxygen X Launches Women-Focused Farming Initiative in Lagos
- Profit-Taking Triggers Market Dip as Investors Lose N476bn
- CBN Relaxes FX Rules, Grants Oil Firms Full Access to Export Earnings
- Tinubu Determined to Reform Power Sector – Shettima
- VP Shettima: Nigeria Resolute on Human Rights, Humanitarian Law
- Power Minister Adelabu Apologizes, Promises Improvement in Two Weeks
- Akpabio Confirms Support for Anioma State Creation
- Masari: Complaints Over APC Forms Meant to Destabilize Party
- APC National Convention: Leadership Signals Readiness and Unity
- Ndi Igbo’s Power Shift: The Obi Cubana City Boy Strategy
- Aftermath of Mob Attack on Suspect Linked to Same-Sex Wedding Raid
- 2026 APC National Convention: As Eagle Square Beckons
- Self-Interest, Not Patriotism Driving OPL 245 Opposition – FG
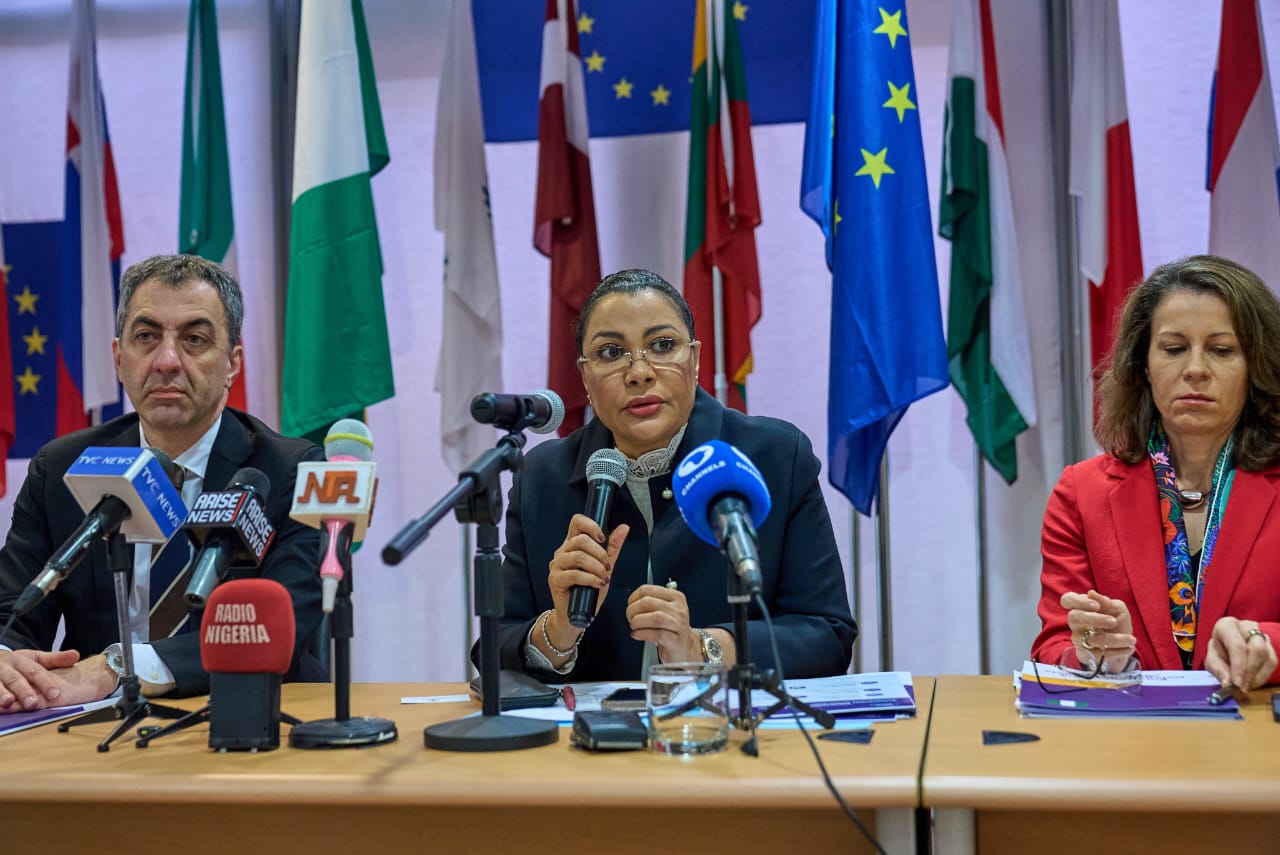
- EU Injects €290m Into Nigeria’s Development Push
- Post-UK Visit, Tinubu Returns To Abuja Amid Key Political Engagements
- FG Introduces Single Window To Fast-Track Cargo Clearance
- Brazil, Not The Team To Beat In 2026 – Vinicius Junior
- TB Response In Niger Hits 8,629 Treated Cases
- APC Expands Grip as Zamfara Governor Joins Fold
- AbdulRazaq Leads APC Committee into 3rd Meeting
- Shettima Meets Swiss VP, Trade, Security Top Agenda
- Shettima Seeks Global Backing for Youth Job Skills
- Davido: Western Validation Doesn’t Matter Anymore
- Arsenal Crisis Deepens with Six International Withdrawals
- NSC Urges Unity Ahead of NBBF Elections
- Yenagoa Set for Int’l 10km Race
- APC Convention Committee Holds 3rd Meeting Ahead of National Convention
- POSTSCRIPT: From Intent to Outcomes — President Tinubu’s State Visit to The United Kingdom
- Fintiri Switches Sides, Backs Tinubu’s Agenda
- Inside the €746M Nigeria–UK Port Modernisation Pact
- From Imports To Independence: Petrol Bill Falls to $10bn
- Hope Rises As Nigeria Introduces HIV Prevention Shot
- Travel Turmoil As ICE Agents Flood US Airports
- From Ferencváros To Nigeria: Bamidele Yusuf’s Big Dream
- NSC Chiefs to Open National Para Sports Festival
- Wike Bloc PDP Sets Up Convention Committee
- Remi Tinubu Condemns Assault at Delta Festival
- Tinubu Hails Ogunbiyi’s TIME Earth Award Milestone
- Tinubu Vows Stronger Security Push Amid Rising Threats
- The Substance, Symbolism of President Tinubu’s UK State Visit
- APC Fixes Date for Aspirants’ Screening
- The Silent Killer in Your Kitchen: Why Ultra-Processed Food is Now Deadlier Than Tobacco
- Nighttime Red Flags: Two Sleep Disruptions That Could Be Early Cancer Warning Signs
- The Body’s Natural Ozempic: How to Trigger Satiety Hormones Without Medication
- Breaking the 20-Year Impasse: “Tumor-Killing” Virus Offers New Hope for Lethal Brain Cancer Patients
- Tinubu Reform Campaign Wins Continental Recognition at SABRE Africa Awards
- Injured Osimhen Departs Galatasaray, Heads Back To Nigeria
- Out of Wedlock: Bisola Aiyeola Speaks On Pain, Growth
- APC Holds South-West Zonal Congress March 25 In Lagos
- Oluremi Tinubu Prays For Leaders, Preaches Love At Lambeth
- Only Nigerians To Be Repatriated Under UK Pact — Interior Ministry
- At Eid Ground, Tinubu Preaches Peace, Shared Responsibility
- Shettima Joins Eid Prayers in Maiduguri, Vows Action on Insecurity
- Tinubu Seals £746m UK Port Deal, Pushes Trade Boost
- Tinubu Praises Nigeria-UK Ties at Historic Windsor Castle Banquet
- Tinubu Meets King Charles in Historic UK Visit
- Nigeria Needs Stronger UK, U.S. Alliance to Combat Terrorism — Sunday Dare
- Political Scientist Francis Onyeama Sets Sights on 2027 Nigerian Presidency
- Army: Abia Robbery Suspect an Impersonator
- Imo Police Arrest 75 Suspects, Recover Arms, IEDs, Stolen Vehicles in Major Crackdown
- Police Arrest Suspected Kidnapper After Failed Abduction Attempt in Edo Community
- Police Rescue Two Kidnapped Cocoa Farmers, Arrest Three Suspects in Ibadan
- Teacher, Two Students Escape Unhurt in Lagos Road Crash
- Para Table Tennis: 8 Days to National Para Games Showdown
- NNL 2025/26: Referees Get Prompt Indemnity Payments — Chichi Nwoko
- Ribéry Picks UCL Favourite For Title Glory
- US Embassy Closes For Eid-el-Fitr
- New Grid Committee Signals Fresh Push To Fix Power Sector
- Tinubu’s Reforms Pull $5bn Into Nigeria’s Oil Industry
- Eid-el-Fitr: FG Announces Thursday, Friday Public Holidays
- After 37 Years, Tinubu Meets King Charles In Historic UK Visit
- Tinubu Sets March 31 Deadline for Appointees Seeking Elective Positions
- Recovered Loot: EFCC Refunds N387m to Jigawa State
- Fasoyin Breaks Silence: “I’m Alive,” Dismisses Viral Death Hoax
- World Cup Blow: FIFA Rejects Eagles’ Petition vs DR Congo
- Oluremi Tinubu to Preach at Lambeth Palace During UK State Visit
- Tinubu Arrives UK for Historic State Visit, To Hold Talks With King Charles III
- KWAM 1’s Daughter Damilola Marshall Declares for Lagos Assembly Seat
- Shettima Mourns Maiduguri Victims, Condemns Killing of Innocents
- Sultan Urges Muslims to Search for Shawwal Crescent Ahead of Eid-el-Fitr
- Tinubu Mourns Terror Victims, Deploys Security Chiefs to Maiduguri
- Tax Reform Architect Oyedele Sworn In as Finance Minister of State
- Nigeria’s Rising Stars Triumph at NCAA Championships
- FG Halts Petrol Import Permits, Backs Local Refining
- Shaffy Bello: Why I Tied My Tubes
- LaLiga’s Pricetag Titans: Top 10
- Tinubu’s Reforms Boost Global Confidence, Strengthen Nigeria–UK Ties — FG
- FG Fulfils Promise to D’Tigress
- UK-Nigeria : A Reset -Building On the Past and Leaping into the future
- Issues in President Tinubu’s UK state visit
- The UK, President Tinubu’s next stop where he comes to negotiate a bilateral trade deal with our former colonial masters Britain that guarantees shelf space for Nigerian goods
- Oluremi Tinubu Celebrates Nigerian Mothers on Mother’s Day
- Gowon Commends Tinubu’s Leadership, Efforts on Economy and Security
- Lamido Urges PDP to Embrace Wike’s Caretaker Committee, Seek Reconciliation
- NDPC Issues Stern Warning to Content Creators Over Privacy Breaches
- FG Unveils PICOMS Portal to Curb Procurement Delays in Education Projects
- NigComSat Dismisses Allegations of $11.44 Million Debt Dispute with Chinese Partner
- INTERPOL Shuts 45,000 Malicious IPs in Nigeria Operation
- CBN Mandates Liveness Checks and Device Limits to Combat Digital Banking Fraud
- Our Bond With London By Eric Teniola
- Bola Ahmed Tinubu Mourns Super Eagles Legend Henry Nwosu at 62
- President Tinubu Directs Renewed Hope Ambassadors to Distribute Rice Nationwide for Ramadan and Lent
- Angel’s Wedding Reveal Sets Social Media Abuzz
- Henry to Critics: Be Fair to Mbappé
- Health Expert Warns: Nigerians Need 7–9 Hours Sleep
- Kalu to Rivals: APC Will Leave No Seat Behind in Abia
- Tinubu Inaugurates Task Force to Revamp Oil Industry
- NSC Appreciation Tour Arrives Uyo, Athletes Honoured
- Coal City Games 2026 Lands Major SEDC Backing
- FEC Approves 100% Gratuity for Retiring Federal Civil Servants
- Nkechi Blessing Links Men’s Body-Shaming to BBL Surge
- Omah Lay Opens Up About Grammy Heartbreak
- Ayra Starr Defends Naija Men, Compares to NYC Finest
- Chude Jideonwo Reveals Secrets of Nigeria’s Metropolis
- Timaya Sparks Controversy With “Baby Daddy” Advice
- Football Helps Me Focus, Says Wilfred Ndidi After Father’s Tragic Passing
- Alex Iwobi Vows Fulham Will Fight Until the End of the Season Despite Recent Slump
- Bam Adebayo Drops 83 Points to Surpass Kobe Bryant on NBA All-Time Scoring List
- Lionel Messi Denied 900th Career Goal in Inter Miami Draw at Nashville
- Pedro Neto Apologises for Shoving Ball Boy During Chelsea Loss
- FG Moves to Introduce Social Media Age Restrictions in Nigeria
- U.S.-Iran Conflict: Data Centre Attacks Expose Vulnerabilities in Nigeria’s Digital Economy
- Federal Government Set To Connect All Schools To Reliable Internet
- Woman Allegedly Goes Into Hiding With Children, Husband Appeals for Help
- Police Arrest Five Suspected Armed Robbers, Recover Firearm and Stolen Items in Ibadan
- Reps Member Raises Concern Over Rising Kidnappings, Killings in Ekiti Communities
- Army Neutralises Top ISWAP Commander Modu Kunduli, Sparks Tension in Terrorist Camps
- Bandit Attack Leaves Three Dead, 11 Injured in Katsina Community
- Police Arrest two Suspected Robbers, Recover Firearm and Ammunition in Imo
- Middle East War Triggers Largest Oil Supply Disruption in History — IEA
- Iran Video Claims Capture of U.S. Soldiers
- Dino Melaye: Peter Obi Is “Fantastic” but Not Ready for Presidency
- ADC Wuse Ward Suspends FCT Senator Kingibe
- Bola Ahmed Tinubu Reaffirms Commitment to Democracy, Rule of Law
- Oke-Oroma Land Crisis Deepens as Fresh Killing Raises Security Concerns
- Nigeria’s Crackdown on Sachet Alcohol: Public Health Concerns, Industry Pushback and the Future of Cheap Spirits
- FCCPC Cracks Down on Market Violations
- Tinubu Names Lamido Yuguda CBN Deputy Governor
- Tinubu’s Ministerial Nominee Taiwo Oyedele Gets Senate Nod
- 17% Access Oral Health Services in Africa — WHO Report
- Fuel Relief Plan: Tinubu Deploys 100,000 CNG Kits
- FG Freezes Petrol Import Licences
- Yamal’s UCL Record Tops Messi, Ronaldo
- D’Tigress Eye South Korea After Big Win Over Colombia
- Yenagoa Set for International Spotlight as Bayelsa Hosts 10KM Race
- Iraq Requests Delay of World Cup Playoff Over War Concerns
- Kano Hisbah Detains Teens for Organising ‘Pimps’ Birthday Bash
- New Polio Cases Reported in Zamfara State
- Ahead of 2027, Natasha Urges PDP Leaders to Close Ranks
- NRS Academy Unveils Committee for Tax Education Overhaul
- APC Dominance Deepens as Party Governs 32 States
- Tinubu, Pate Reforms Push Pharma Profits to ₦14.8bn
- Tinubu Mourns Ex-Super Eagles Coach Adegboye Onigbinde at 88
- Dangote Leads Africa’s Billionaire Boom with $20bn Wealth Surge
- PDP Factions Await Justice as Leadership Crisis Deepens
- Rising Pump Prices Stoke Inflation Alarm
- Witness Exonerates Yahaya Bello While Court Reviews Disputed Document
- Security Sweep: 45 Militants Killed in Katsina by Army
- D’Tigress Begin World Cup Quest in Lyon
- Tinubu Assures Nigerians of Unity, Vows Defeat of Terrorism
- Tinubu Signs Kampala Convention Act to Protect IDPs
- Team 33 Kicks Off Live Coverage of Nigeria National League
- Airlines Gradually Restore Flights After Middle East Airspace Disruptions
- Petrol Price Climbs Above N1,040 Per Litre in Lagos, Abuja
- Nigerians Repay N1.33tn Personal Loans as Borrowing Declines — CBN
- NSC Delighted as National Boxing Trials End in Grand Style
- NERC says DisCos Generated N207bn Revenue From N258bn Electricity Bills in December
- FG Pushes Women-Led Businesses as Key to Nigeria’s $1tn Economic Goal
- Foundation Moves to End the Silence on Dementia in Nigeria’s Ageing Communities
- How to Maintain Your Fitness Goals During Ramadan 2026
- Nigeria’s Women’s 4x400m Relay Team Qualifies for World Relays in Botswana
- Katsina United Threatens Legal Action Against AWOL Top Scorer Uche Collins
- Lookman and Atletico Madrid Edge Past Real Sociedad in Thrilling Copa del Rey Final Rehearsal
- Osimhen’s Header Decides the “Battle of Super Eagles Captains” in Istanbul Derby
- Messi Reaches 899 Career Goals as Inter Miami Edge Past DC United 2-1
- Abba Moro Stays Loyal to PDP Amid Mass Defections
- Tinubu Approves Military Salary Hike, Pledges Better Welfare
- Akwa Ibom Women Endorse Tinubu, Akpabio, Gov Eno for 2027
- Oluremi Tinubu Celebrates Women on International Women’s Day
- OPL 245 Settlement Will Boost Economy, Strengthen Fiscal Position – AGF Fagbemi
- Mrs. Yetunde Olopade of Nilayo Sports Wins Newstap/SWAN 5-Star Award
- NNL 2025/2026: Ogun State Showdown; Gateway FC Takes on Beyond Limits
- Freed Actor Baba Ijesha Breaks Silence, Warns of Human Wickedness
- FIBA Rankings: D’Tigers Fall to 53rd Globally
- Police Raid Kidnap Network in Edo, Arrest 65, Recover N1.8m
- Naira Slips Slightly Against Dollar
- Tinubu Sets Up GAMCO Committee to Tackle Stranded Power, Fix National Grid
- Tinubu Approves Posting of 65 Ambassadors to Foreign Missions, UN
- New Study Finds Microplastics in 90% of Prostate Cancer Tumors
- Researchers Push for National Wastewater Surveillance to Catch Outbreaks Early
- Nigeria’s Metering Rate Climbs to 57% as DisCos Add 678,000 Customers in 2025
- Canal+ to Discontinue Showmax After MultiChoice Takeover
- NDLEA Seizes 2.55m Kg of Drugs Worth Over N3tn at Nigerian Seaports in Five Years
- Anthony Joshua Undergoes Rib Treatment and Rehab Following Tragic Accident
- 128 Boxers Battle for 10 Slots at 2026 Commonwealth Games Trials in Lagos
- NSC Gifts Majekodunmi ₦3m as Tour Continues
- NSC Eyes Inclusive Growth at 3rd National Para Games
- Tolu Arokodare Beats Virgil van Dijk as Steven Gerrard Defends Striker
- NFF Dismisses Reports That Super Eagles’ World Cup Hopes Are Over
- CAF Postpones 2026 Women’s Africa Cup of Nations in Morocco
- Senator Seriake Dickson Dumps PDP for Newly Registered NDC
- First Lady Tinubu Hosts State First Ladies on RHI Progress
- President Tinubu Renews Appointment of NIPSS DG Prof. Ayo Omotayo
- Shettima: Tax Reforms Will Ease Burden, Not Impoverish Nigerians
- Presidential Team Joins Strategic Meeting on Non-Kinetic Peace Approaches
- Tinubu Meets ENI CEO as OPL 245 Dispute Ends, Investments Loom
- Nigeria–United States Military Partnership Focused on Training and Intelligence Sharing, Not Establishment of Military Base – Says Defence HQ Spokesman
- Nigeria–US Military Cooperation Centers on Training, Intelligence Sharing — DHQ
- Tinubu Suspends Airport E-Toll Over Flight Disruptions
- Tinubu Sends Five-Member Delegation to Jesse Jackson’s Burial
- Tinubu Swears In Tunji Disu as 23rd Inspector-General of Police
- Cashless Drive: Zamfara Governor Ends Cash Revenue System
- Super Falcons Dominate as Cameroon Fall 3–1 in Yaounde
- Edo Flood Tragedy: Two Children Drown
- NNPC Unfolds 2026 Blueprint to Drive Gas Growth
- Fuel Price Hike Bites Hard in Abuja, Lagos
- From Tax Reforms to Finance Ministry: Oyedele Nominated
- Marafa Records Milestones at RMAFC, Earns Fresh Recognition
- Tinubu Nominates Taiwo Oyedele as Minister of State for Finance
- Ahmed Musa Quashes Transfer Rumours
- Nigeria’s Democracy Gets Fresh Endorsement From UN
- Minister Rallies Youth to Lead Fight Against Fake News
- Gunmen Raid Niger Communities, 15 Feared Dead
- Nigeria Moves to Unlock OPL 245 With Four-Block Development Plan
- Police Council Ratifies Disu as IGP, Tinubu to Swear Him In Wednesday
- The ‘code of silence‘
- The One-Eyed Man
- Oil Climbs Above $72 on Rising Middle East Tensions
- AI-Driven Chip Shortage May Push Smartphone Prices Up 20% in Nigeria
- NESG Urges Nigerian Entrepreneurs to Prioritise Exports and Digital Expansion
- NNPC Targets July 2026 First Gas as AKK Pipeline Spurs Fresh CNG Investment Drive
- Mascot Ikwechegh Quits APGA, Future Party Plans Unknown
- Iran’s Supreme Leader Khamenei Killed in U.S.–Israel Strikes
- Gen. T.Y. Danjuma Visits President Tinubu at State House
- Tinubu Renews Abubakar Audi’s NSCDC Tenure
- Nigeria’s GDP Hits 4.07% in Q4 2025, Signaling Strong Economic Recovery
- Obasanjo Applauds Naira Stabilisation as Boost for Tinubu Administration
- Hope Uzodinma Fires Up The One message, One Party, One Mobilization Framework movement
- Top Spot Up For Grabs: Beyond Limit FC Takes on Inter-Lagos FC in NNL Showdown
- Stop Lamentation Over Electoral Act, Presidency Tells ADC, NNPP
- Court Voids Malami’s Bail, Orders Remand in Kuje Prison
- Osimhen Slams Gala Squad After Champions League Win
- Nigerian Blind Female Sambists Set to Make History at World Cup
- D’Tigress Announces Provisional Squad for World Cup Qualifiers
- PSG Escape Monaco Test to Book Last-16 Place
- Atletico Boss Explains Lookman Bench Role
- Nigerian Stocks Slip as N73bn Wiped Off Market Value Amid Broad Sell-Off
- ECOWAS Raises Alarm Over Low Uptake of Duty-Free Trade Scheme at Seme Border
- LCCI Backs CBN Rate Cut, Urges Sustained Reforms to Lower Business Costs
- Tinubu Extends Ban on Raw Shea Nut Exports to Boost Local Processing
- PDP Chieftain Urges Probe into Attack on ADC Members in Edo
- Dr. Essiet Begins Citizen-Focused Engagement in Kwara State
- Wike Describes Mpigi’s Death as Loss to Rivers and Nigeria
- President Seeks Constitutional Backing for State Police
- FG Inaugurates CREDICORP Board, Targets Wider Credit Access by 2030
- First Lady Tinubu Honoured as Utukpa-Oritse, Appeals for Unity
- B’Odogwu is Live: Nigeria Launches Digital Customs System to Simplify Trade
- Ray Amodi Leaves Nollywood to Chase Music Career
- CBN Eases Monetary Policy, Cuts Key Rate
- Court Hears Case in Fatal Crash Involving Joshua’s Associates
- Fresh Crude Export Plan Targets Higher Oil Revenue
- Presidency Pledges ₦50M to Fight Social Vices in Schools
- Kalu Seeks Unity in Abia APC, Backs Tinubu 2027
- Tinubu Pushes State Police, Praises NASS Reforms
- Shettima Reaffirms FG Fire Safety Plan, N5bn Relief for Kano Traders
- Tinubu Charges New IGP to Restore Public Confidence, Strengthen Discipline
- Disu Pledges Zero Tolerance for Corruption, Says Citizens Are ‘The Boss’
- AMAC Chair Named North Central Coordinator of RTIFN
- Osimhen in Galatasaray Squad for Juventus Clash
- CBN Slashes Interest Rate to 26.50% in Monetary Policy Shift
- Shettima Highlights Economic Gains, Urges Ambassadors
- Abuja 2026: Facilities Earn High Marks After Para Games Inspection
- Police Shake-Up: Tinubu Accepts Egbetokun’s Exit, Names Disu Acting IGP
- IDA Team Joins 2026 Games as 38th State
- Fresh Drive for Professionalism in Nigeria National League
- 2027 Will Be Referendum on Reform, APC Chairman Tells Strategic Summit
- Uzodimma Unveils Unified Mobilisation Blueprint as APC Targets 2027
- Abia APC to Hold Harmonised Ward, LG Congresses Feb 25–26
- Ighalo and Lawal Back Ademola Lookman for Success at Atletico Madrid
- ‘Handle the Noise or Leave’ – Arteta Issues Bold Challenge to Arsenal Squad
- Jake Paul Undergoes Second Jaw Surgery Following Joshua Knockout
- Sports Federation Bosses Commend Tinubu’s Proactive Reforms in Nigerian Sports
- Cristiano Ronaldo Hits Historic 500-Goal Milestone Since Turning 30
- Lagos Cracks Down on Environmental Hazard, Seals Obalende NITEL Building
- Every Child Counts: Nigeria Records 14 Million New Birth Registrations in Two-Years
- How Pet Cats Are Unlocking New Paths for Human Breast Cancer Treatment
- New Partnership in Kano Set to Bridge Specialist Gap in Northern Nigeria Cancer Care
- Lagos Fortifies Health Defenses as Japan Delivers $1.7m in Cholera Relief
- Ogun Monarch Backs Iyabo Obasanjo’s Governorship, Calls for More Women Leaders
- CJN Kekere-Ekun to Swear In Justice Oyewole as Supreme Court Justice Wednesday
- Ramadan Timing Responsible for Low Turnout in FCT Polls — Bashir Ahmad
- UNICEF Applauds Nigeria’s Surge in Birth Registration
- President Tinubu Celebrates FCT, Kano, Rivers Election Winners
- APC Sweeps FCT Councils, Wike Cites Renewed Hope Momentum
- 2027: Sunday Dare Empowers Ogbomoso Grassroots Team with Campaign Bus
- The Importance of Having Chia Seeds and Milk During Ramadan
- AI Ventures Accelerator Offers $10,000 for Women-Led African Startups
- FG to Review MTN’s $6.2bn IHS Acquisition
- Nigeria Crypto Startups Seek Review of ₦2bn SEC Rule
- Unity Bank–Providus Merger Nears Completion
- FX Access Sparks 366% Rise in Nigerians’ Overseas Travel Spending
- FG Plans N800bn Investment in Agro-Processing, Renewables
- TotalEnergies Targets Near Net-Zero Gas Output
- Global Football Stars Rally Behind Vinicius Jr. Following Alleged Racist Abuse
- Philippe Coutinho Leaves Vasco da Gama, Cites Mental Exhaustion
- Boniface Ruled Out of The Season Despite Rehabilitation Progress
- Adesanya Calls Pyfer Bout His “Biggest Fight”
- Sunday Oliseh Backs Arsenal for Champions League Glory
- Uzodinma Urges Unity Ahead of Imo APC Congresses
- Rivers Assembly Halts Fubara Impeachment Proceedings
- Lagos APC Dismisses Backlash Over Tinubu’s Assent to Electoral Act 2026
- Tinubu, German Chancellor Merz Agree on Security, Power, Rail Cooperation
- Tinubu, Uzodimma, Uba Sani: The Renewed Hope Team Driving National Unity
- NSC Sets Dates, Opens Para Games Portal
- Benin ₦143m Fraud: Two Docked in Major EFCC Crackdown
- El-Rufai in Second Night of EFCC Custody Over ₦432bn Probe
- Frank Onyeka Breaks Silence After Coventry City Championship Debut
- Kano Hisbah Board Restricts Tricycle Operations for Ramadan
- Tinubu Orders Direct Oil Revenue Remittance
- Tinubu Signs Electoral Act Amendment into Law
- President Tinubu Signs Electoral Act Amendment Bill
- Tinubu Urges Unity as Lent, Ramadan Begin Same Day
- Uba Sani Appointed APC Renewed Hope Ambassador
- Tinubu launches national child food bank campaign
- First Lady Calls for Reflection, National Prayers at Start of Lent
- Oluremi Tinubu Urges Prayers for Peace, Prosperity as Ramadan Begins
- Ooni of Ife Adeyeye Enitan Ogunwusi: Summit Drives Health Unity
- Ruler Urges Tinubu to Resolve Kanu Detention Crisis
- Tinubu Cheers Nigeria–UAE Industrial Deal as BUA Seals Abu Dhabi Partnership
- Inflation Eases as CPI Drops to 127.4 in January, Rate Slows to 15.1%
- Mourinho Names Trophy Favourites, Calls Them “Kings”
- National Assembly of Nigeria Approves N1.5tn 2026 Army Budget
- Kenneth Eze Proposes 16-Year Single Term for Presidents
- Customs intercepts suspected cocaine worth N1bn along Badagry-Seme border
- Lagos says 1.5 million residents actively served by public water system
- Report Reveals Costly U.S. Deportations to Third Countries
- Panama opens permanent residence pathway for long-term international students
- Health in the Marketplace: Oyo State’s Bold Outreach at Ajegunle Market
- Fighting for the Fifth Birthday: Experts Call for Universal Sickle Cell Screening
- Taraba’s 14-Year High: The Deadly Cost of Delayed Hospital Visits
- Falconets Overpower Senegal, Set Up World Cup Decider Against Malawi
- Ex-Chippa United Goalkeeper Questions Nwabali’s Shock Exit
- Singapore, Hong Kong Offer Six-Figure Olympic Bonuses
- Peter Obi Confirms 2027 Presidential Bid
- Nigeria Backs AU Peace, Security, and Development Reforms
- Oluremi Tinubu Honors Late Chief Ojora in Condolence Visit
- Tinubu Condoles Kano Traders, Orders Market Fire Probe
- Tinubu Visits Adamawa Monday, To Inaugurate Projects, Meet Leaders
- Kebbi : Beyond Borders, President Tinubu’s Re-opening of the Tsamiya and Kamba borders, a stroke of Economic Diplomacy
- Tinubu Heads to Kebbi Saturday for Project Commissioning, Argungu Festival
- Independent National Electoral Commission Sets Feb 20, 2027 Poll Date
- African Tech Funding Hits Record Low as Investors Turn Cautious
- EU Weighs Sanctions Over WhatsApp AI Restrictions
- Israel Adesanya Hints at Retirement by 2027
- Super Falcons Gear Up for WAFCON Title Defence with Abidjan Tournament
- Frank Onyeka’s Coventry Debut Delayed as Wife Prepares to Give Birth
- CAF Starts Stadium Checks for AFCON 2027
- How traders use triangle patterns to confirm breakouts and manage risk
- Strategic imperatives for investors under Nigeria’s Petroleum Industry Act
- Conoil faces dividend uncertainty amid earnings decline and share price slump
- Dangote Refinery expansion expected to boost output and GDP contribution
- Tinubu Hails BOI’s Record N636bn Loans as Validation of Economic Reforms
- Tinubu Mourns Scholar, Former ASUU President Prof. Biodun Jeyifo
- El-Rufai Condemns Airport Arrest Attempt, Urges Respect for Rule of Law
- Atiku Endorses ADC, Says Party Can “Salvage Nigeria”
- Oluremi Tinubu Named Leadership Newspapers Person of the Year
- Shettima Lands in Addis Ababa for AU Summit
- Sokoto Governor Approves Early February Salaries Ahead of Ramadan
- Nasir El-Rufai to Appear Before EFCC on Monday
- Osayi-Samuel Hails Osimhen as Superior Striker to Haaland
- Peseiro Explains Why Lookman Chose Nigeria Over England
- Kola Daniel Joins 2027 Africa School Games LOC
- Africa Running Conference 2026 Kicks Off in Lagos
- Electoral Act: Real-Time Transmission Does Not Guarantee 100% Transparency — Dare
- Electoral Bill: Akpabio Signals Imminent Tinubu Assent
- EFCC Witness: Banks Behind 2022 Naira Scarcity
- NRS Hits ₦28.3tn in 2025, Targets ₦40.7tn Revenue for 2026
- Bergkamp Predicts Title Winner as EPL Enters Decisive Stretch
- Tinubu Appoints New SHESTCO MD, NEMSA CEO and Board, Sends RMAFC Nominees to Senate
- South East Exclusion Claims Rock Passport Printing Policy
- Real Madrid Dream: Chelle Speaks on Coaching Ambition
- No Romance: KWAM1’s Daughter Dami Dismisses Asake Rumours
- BSUTH Reopens Clinical Services After Resident Doctors Call Off Strike
- Natasha Suspension Stands as Appeal Court Backs Senate
- NIS denies barring any region from passport issuance
- CAC deregisters over 400,000 inactive, non-compliant companies in 2025
- Veekee James and Husband Femi Atere Announce First Pregnancy
- Ebuka Obi-Uchendu Surprises Wife with Romantic Re-Proposal in Vatican City
- As South-East Progressively Aligns With The Tinubu Administration
- EFCC Uncovers N70m POS Fraud Scheme
- Tinubu Celebrates Afenifere Chieftain Abagun Kole Omololu at 70
- Tinubu Launches New Development Push at NEC Conference
- 5 Days to Go: Lagos Braces for High-Stakes Marathon Showdown
- ADC’s Aminu Tambuwal Refuses to Sit Under APC Flag in Viral Video
- SDP’s Adebayo Calls Tinubu an ‘Emperor with Many Servants’
- IPOB Cancels Monday Sit-At-Home in South-East
- NARD Condemns Assault on Doctor at FMC Owo, Demands Compensation
- VP Shettima to Chair NEC Conference on Inclusive Growth
- Kano Pillars, Remo Stars Clash in Relegation Six-Pointer
- Niger Tornadoes Threaten to Withdraw from NPFL Over Stadium Ban
- Bendel Insurance Defeat Enyimba 2-0 as 16-Year-Old Debuts with Goal
- Osimhen Backs Eric Chelle for Long-Term Eagles Role
- Simeone Plans Custom Role for Ademola Lookman After Impressive Debut
- CBN Flags Fintech’s Heavy Reliance on Foreign Capital
- Shettima to Chair NEC Conference as FG Pushes Inclusive Growth Agenda
- VP Shettima Hails Imo at 50, Pledges Increased Federal Support
- Tinubu’s Sports Drive Powers Nigeria’s Davis Cup Return After 19 Years
- Kaduna Ranks 2nd Nationally for Ease of Doing Business
- Leão Honors Ronaldo with Birthday Song at 41
- Ibrahim: Remi Tinubu Boosts Nigeria’s Image
- Matawalle Hosts Joint Wedding Ceremony for Nine Children in Abuja
- Army Dismantles Edo Kidnap Hideouts, Arrests 13
- Tinubu Hails Pate, Makanju Over Devex Power 50 Recognition
- Advocates Call for Local Govt Autonomy to Curb Child Deaths
- Steven Sparks Sparks Debate on Juju and Africa’s Progress
- Juliana Olayode Refuses On-Screen Kisses, Revealing Outfits
- Kunle Afolayan Seeks Divorce to Pursue Polygamy
- Timini Egbuson Laments Losing ‘Soulmate’ to Money
- Simi Slams Critics Using Her Life to Judge Women
- “President Belt” Boxing Championship Set for April in Nigeria
- Ajagba, Itauma, Oshoba Target World Boxing Titles in 2026
- Nigeria Cricket Unveils 2026 Women’s T20I, U-17 Championship
- INEC Endorses Wike-Led PDP Caretaker Committee Amid Party Crisis
- Tinubu Holds Strategic Talks on Tax Reforms with Ombudsman, Finance Officials
- Tinubu Orders Army to Kaiama After Terror Attack
- Stanley Nwabali Leaves Chippa United
- President Tinubu Expands Women’s Economic Programme to 25 Million Nigerians
- Senate Retains Electronic Transmission of Election Results
- The New Aristocracy: When Your Surname Becomes Your Credential
- PUMA Joins Access Bank Lagos City Marathon as Official Apparel Sponsor
- Seyi Tinubu Inaugurates RTIFN State Coordinators in Abuja
- Tinubu-Ojo Receives Ondo Lifetime Award for President Tinubu
- VP Shettima Launches 25-Year South-East Economic Blueprint
- Remi Tinubu Calls for Compassionate, People-Centred Cancer Care
- Gabriel Suswam Dumps PDP, Joins APC
- Wike: FCT Growth Will Not Be Derailed By Politics
- NNPCL Suspends Refinery Operations To Stop Value Erosion
- Abeokuta Hosts Senegal Lionesses Ahead U-20 Falconets Clash
- Tinubu Hosts World Bank, IFC Delegation at Aso Villa
- Tinubu: Nigeria Ready for Secure, Cleaner Energy Push
- Breakdown of Terror Financing Charges Against Ex-AGF Malami, Son
- PDP Crisis Deepens as Umar Sani Faults Court Verdict
- NECO Releases 2025 External SSCE Results, High Pass Rate Recorded
- Lookman Joins Atletico Teammates in First LaLiga Training Session
- Why Kogi’s FAAC Windfall Makes Its Sukuk Plan Untenable
- Dosu Critiques Nwabali’s Approach
- Six Injured in Third Mainland Bridge Bus Crash
- Labour Unions Set Solidarity Rally for Striking FCDA Workers
- Electoral Act Amendment Useless Without Enforcement — Falana
- Nine Suspects Arraigned Over Deadly Benue Attack
- FG Signs MoU, Launches Free Training for 10 Million Nigerians
- Uzodimma to Chair APC 2026 National Convention Coordination Committee
- Ogun Stakeholders Launch Initiative Against Unsafe Abortions
- 5 Essential Habits to Protect and Improve Your Vision
- Parents Raise Fears Over Children’s Development After Vaccines
- Nigerian Built Applications Surpass 1 Million Sales Milestone – NOTAP
- PayPal Partnership With Paga Sparks Debate
- OpenAI to Stop GPT-4o on February 13 as GPT-5 Takes the Top
- NCC Audit Reveals Mobile Coverage Reaches 78% of Nigeria’s Major Roads
- Tinubu Welcomes Governor Kefas to APC, Promises Taraba Development
- 16 Officers to Face Trial Over Foiled Coup – Defence Minister
- Imo State Celebrates 50 Years of Progress and Unity
- First Lady Oluremi Tinubu Marks World Hijab Day 2026
- Nigeria Celebrates World Interfaith Harmony Week 2026, Urges Unity Across Faiths
- Tinubu Hails Fela’s Historic Grammy Lifetime Honour
- Lagos, British Cycling Move to Partner on Knowledge Exchange, Skill Transfer
- SL AKINTOLA – The Thunder Of History
- Woman escapes kidnap after conversion to Christianity
- Nigerian Exchange slips 549 points, struggles to hold 165,000 level
- Accord Confirms Adeleke’s Nomination for Osun Governorship Race
- APGA Releases Timetable for 2026 Anambra LG Primaries
- BUA Foods Posts ₦507.7bn Profit as Strong Sales Offset Rising Costs
- NNPP Faction: Yusuf Left Over Kwankwaso’s Control, Not Ambition
- First Lady Commissions Dream Centre at OAU
- Ibadan Lecture Honours SL Akintola, 60 Years On
- FG Raises ₦501bn Toward ₦4trn Power Debt
- Nigeria on Alert Over Multiple Disease Outbreaks — NCDC
- Nation Loses Industrial Titan as Tinubu Mourns Otunba Ojora
- Shettima Urges Peaceful Coexistence on Palace Visit in Jos
- Diezani Faces Corruption Charges as London Trial Starts
- Atiku Abubakar’s Cognitive Dissonance
- CBN Approves Temporary Use of Expired NAFDAC Licences for Imports
- ‘What I Faced as Super Eagles Coach’ – Oliseh Speaks
- ‘Charade!’ – Kanu’s Lawyers Blast Prison Transfer Hearing
- Wike Stands Firm: FCT Strike Requires Talks, Not Threats
- Lawmakers Back Soludo Amid N19.6bn Market Loss
- Türkiye Targets $5bn Trade Volume with Nigeria – Erdogan
- Mutfwang Joins APC as Shettima Says Party Is Home for All Nigerians
- President Bola Tinubu’s state visit to Turkey: The quick wins
- Tinubu, Erdogan Deepen Nigeria–Türkiye Ties During State Visit
- Alausa Honours First Lady, Prof. Ahmad at National Teachers Summit in Abuja
- JAMB Mandates Live CCTV for 2026 UTME
- NFF, Super Eagles Mourn Ndidi’s Father
- Remembering the Ikeja Bomb Blast: Nigeria’s Dark Sunday of January 27, 2002
- Oluremi Tinubu Urges Shift to Clean Energy
- President Tinubu Beats A New Path In Nigeria Türkiye Partnership Says Presidential Spokesperson, Sunday Dare
- Scientists Uncover Sleep’s Role in Preventing Alzheimer’s
- Delta Backs Cancer Advocate with ₦10m Donation
- NAFDAC Busts Factory Producing Fake Anointing Oil
- Lassa Fever Alarm in Benue: Two Dead as Outbreak Spreads to Health Workers
- 2.5 Million Residents in Ebonyi Struggle with Open Defecation Daily
- LivingTrust Mortgage Bank Posts ₦1.01bn Profit
- NGX Money Market Funds See Strong 2025 Growth
- Google Trends Show Nigerians Focus on Entrepreneurship and Well-Being
- Nigeria’s Currency Outside Banks Hits ₦5.4 Trillion
- Over 94% of Nigeria’s Cash Circulates Outside Banks
- Beatrice Ekweremadu Returns to Nigeria After UK Prison Release
- VP Shettima: Nigeria Reclaims Global Economic Spotlight
- Ex-Defence Chief Warns of Forces Seeking to Destabilise Nigeria
- Musawa Says Atiku Unlikely to Defeat Tinubu in 2027 Elections
- Former Lawmakers Back Tinubu’s Re-Election Ahead of 2027 Polls
- Court Orders 48 to Report to SSS Over Fraud Case
- Ahead Of President TINUBU’S Trip To Turkey, Sunday Dare X-trays The Significance Of The Trip To Both Countries
- Renewed Hope Global Tour Attracts New Investments in Switzerland
- NSC Sets Pre-Games Camp for Team Nigeria
- Nigeria, Türkiye Set for Fresh Strategic Talks as Tinubu Visits
- Tinubu’s Reforms Recalibrating Nigeria’s Fourth Republic, Says Dare
- 21 Days to Lagos Marathon: East, West African Stars Set for Showdown
- From gun-blazing to partners: Appraising President Tinubu’s diplomatic masterclass
- Nigeria’s 4th Republic : What Is Working And What Is Not By Sunday Dare
- Sachet Alcohol: NAFDAC Rolls Out Nationwide Enforcement Drive
- Over 800 Newborn Deaths Daily Sparks National Emergency
- VP Shettima Unveils Nigeria’s Food Security Macro-Strategy at Davos
- Baba-Ahmed: Atiku Better Positioned Than Obi for ADP Convention
- Kano Emir Juggles Royal Duties and University Studies
- FG Pledges Action on Ibadan Floods as Olubadan Seeks Urgent Intervention
- Tinubu Approves Posting Of Four Ambassadors-Designate To Key Global Missions
- Tinubu Targets Jobs, FX with Fresh Push for Deep-Offshore Projects
- Tinubu, Shell in Talks Over $20bn Bonga SouthWest Project
- Tinubu’s Tough Choices Are Fixing Structural Injustice — Dare
- Nigeria Beat Algeria Again, Extend Strong 2026 Start
- Odimayo and the Art of People-Focused Lawmaking
- 11th Access Bank Lagos Marathon to Run on New Route
- Mutfwang Expresses Confidence in Tinubu as Reserves Improve
- Gratitude And Growth: Uzodimma Marks Six-Year Milestone
- Togo Hands Over Former Coup Leader Damiba To Burkina Faso
- March 25 Set For EFCC–Oceangate $13m Case
- Trump Orders Recall, US Envoy Richard Mills Exits Nigeria
- Portable Out On Bail, Ends Week-Long Detention
- Senegal Walkout: Le Roy Breaks Silence On Message To Mané
- WEF 2026: Nigeria Enters Global Economic Spotlight with Davos Pavilion
- NYSC Secures ₦2bn Fund to Support Young Entrepreneurs
- AFCON Triumph Tainted by Senegal Walkout, Infantino Reacts
- Abuja Grinds to Halt as FCTA, FCDA Workers Begin Strike
- Abba Yusuf, Tinubu Hold Closed-Door Talks at Aso Rock
- Borno: Troops Overrun Terrorist Camps, Prevent Major Assault
- Tinubu Congratulates Alake on AMSG Re-Election
- NCR Nigeria rallies 76.8% in 2026 despite weak fundamentals
- Nigerian startup, MAX secures $24m to scale electric vehicle financing
- Lagos Taskforce Arrests Six Over Attacks on Stranded Motorists
- IMF Warns AI Job Disruption Is Reshaping Global Labour Markets
- Kwara Fire Service Averts Disaster as Petrol Tanker Burns in Ilorin
- Kano Governor Orders Manhunt Over Dorayi Family Killings
- Osun Court Remands Five Suspects Over Alleged Ritual Attack on Teenager
- Police Detain 80-Year-Old Man Over Fire That Destroyed Family House in Imo
- FG Sets Up National Task Force to Boost Clinical Governance, Patient Safety — Pate
- ADC Demands Transparency on US–Nigeria Health Cooperation Deal
- Gbenga Daniel Says Nigeria Has Moved Past Its Toughest Period
- Ejimakor Says Kanu Judgment Could Influence Igbo Voting Pattern in 2027
- Otti Says Fixing Abia, Not 2027 Politics, Is His Priority
- More Than Medals: How the Super Eagles’ AFCON Journey Tells the Story of Nigerian Grit
- Tinubu Hails Super Eagles After AFCON Bronze Medal Win
- Shettima Attends Guinea Inauguration, Reaffirms ECOWAS Role
- Tinubu Returns, Nigeria Seals Trade Deal with UAE
- Tinubu Celebrates Bisi Akande at 87
- Cultists Foiled in Alleged Abduction Attempt of Daughter of Fleeing Edo Man
- Yobe State clears N15.4bn gratuity backlog owed to retirees
- Dangote Refinery targets fuel price stability despite global crude oil volatility
- Kano Suspends 3 Health Workers Over Surgical Error Death
- Police Arrest Suspect Over Alleged Acid Attack on Teenager in Adamawa
- Suspected Human Trafficker Nabbed in Makurdi with Seven Underage Boys
- Court Dismisses Akpoti-Uduaghan’s Defamation Case
- Man Hospitalised as Truck Carrying Rubber Materials Catches Fire in Oyo
- Oyedele Denies Suspension of Tax Guidelines
- Baba-Ahmed: Defeat Tinubu Through Action, Not Courts
- Nigeria’s Inflation Hits 15.15% in December
- NEC: Shettima Chairs Council On Ranching, Livestock Development
- Armed Forces Day: Tinubu Honours Fallen Heroes, Backs Military
- Global Travel Disruption As US Pauses Visa Processing In 75 Countries
- TCN Restores Power To Taraba After Prolonged Outage
- World Bank: Tax Reforms to Lift Nigeria’s Growth to 4.4% By 2026
- Catholic Knight Renounces Faith After Cathedral Ignores Ubah’s Legacy
- AFCON Semi: Five POTY Winners Clash
- Nigeria, UAE Seal Major Trade Deal
- Shettima Urges Selfless Service, Celebrates Hadiza Bala Usman at 50
- Tinubu Reaffirms Nigeria’s Net-Zero, Energy Access Goals
- Dollar Pressure Persists as CBN Reforms Tested
- Nigeria Pushes Gas Expansion to End Electricity Outages
- Xabi Alonso Sacked by Real Madrid
- Rema Wins Big with Three Awards at 9th AFRIMA
- Army Saves 18 in Cameroon-Bound Boat Hijack
- Tuggar: Nigeria Seeks Funding, CEPA Deal at Abu Dhabi Sustainability Week
- Tinubu Attends UAE Sustainability Summit
- CBN, NCC to Enforce 30-Second Airtime Refunds
- FCCPC Set To Stop 103 Loan Apps From Operating
- Drama as Portable’s Baby Mama Allegedly Seeks His Arrest
- Victor Boniface Reveals Struggle Behind Injury Smile
- Carter Efe Goes Viral After Revealing Year-Long Single Status
- Barcelona, Real Madrid Set for Super Cup El Clásico
- Purdue Power Past Penn State as Big Ten Race Tightens
- NFL Wild Card Weekend Kicks Off with High-Stakes Clashes
- BUA Chair Rabiu Pledges $1.5m Bonus for Super Eagles’ AFCON Win
- Impeachment Move: Fubara Calls for Calm, Says Situation Will Be Resolved
- Politicians Intensify Pre-2027 Campaigns Despite No Official Election Season
- Democracy Under Threat Began with Atiku, Not Tinubu — APC’s Okechukwu
- Ganduje Returns to Nigeria After Dubai Stay, Set for Key Political Talks
- Nigeria to Face Morocco in AFCON Semi-Final Clash
- Response To KPMG: Observation on Nigeria’s New Tax Laws
- FG Secures Release of Nigerian Pastor in Benin
- Measles-Rubella Rollout Begins in Osun, Expert Assures on Vaccine Safety
- Three Science-Backed Strategies to Optimize Your Digestion
- Analysts, BDCs Predict Stronger Naira on FX Inflows
- Nigeria’s Business Growth Hits 12 Months, Costs Dampen Confidence
- BVN Enrolments Hit 67.8 Million in 2025 as CBN Initiatives Drive Surge
- KPMG Warns New Tax Laws May Trigger Disputes, Capital Flight
- Lagos, UNILAG Strategize Ahead of National Under-18 Games
- AFCON 2025: Super Eagles Barred from Interviews Ahead of Algeria Clash
- Lagos Assembly Approves ₦4.4 Trillion 2026 Budget
- Oluremi Tinubu Appreciates Women Leaders, Calls for Continued Support in 2026
- INEC Urges Lagos Residents to Join Voter Registration Phase 2
- Regina Daniels Threatens Ned Nwoko Over Drug Claims
- Phyna Seeks Reconciliation with Davido Two Years After Online Feud
- Adekunle Gold and Simi Welcome Twins, Expand Family
- Oyo Police Warn Against Drowning Risks
- Tinubu Condoles Chimamanda Adichie on Death of Son
- A Rejoinder to “Bola’s Tax”: When “Simple Logic” Becomes Simple Misdirection
- Doris Uzoka-Anite, CBN Fast-Track FX for Super Eagles Bonuses
- Asari Dokubo Vows Support for Tinubu’s 2027 Re-election
- Court Grants ₦500m Bail to Malami, Wife, Son
- US Imposes Up to $15,000 Visa Bond on Nigerian Visitors
- Dare, Folarin, Fatai Buhari, other APC Leaders rally for TINUBU’S reelection in Ogbomoso
- NFF Welcomes Arthur Okonkwo’s Switch to Nigeria
- FG Targets WAEC, NECO Malpractice with New 2026 Reforms
- Chelsea Confirm Liam Rosenior as New Head Coach
- NYSC Sets Jan 21 for 2026 Batch ‘A’ Stream I Orientation
- Alleged Missing ₦128bn Predates My Tenure, Adelabu Tells SERAP
- APC Rolls Out Statewide E-Registration in Ondo
- Tinubu Seeks Senate Confirmation for 21 Nominees to NUPRC, NMDPRA Boards
- NGX All-Share Index Tops 156,000 in New Year Rally
- NGX Announces Full-Year 2025 Index Review, Adding Guinness Nigeria, Presco, and Wema Bank
- Low-Income Earners to Benefit Most from New Tax Reforms – NRS Chairman
- NNPCL Cuts Petrol Price to N815 per Litre in Abuja
- China Rejects Role of Any Nation as ‘World’s Policeman’
- Lagos Plans N7bn Jetty at Oworonshoki Waterfront
- Bago: Kasuwan Daji Attack Cuts Across Faiths, Communities
- Kwankwaso: I’ll Defect Only for Presidential or VP Ticket
- 2027: I Never Opposed Backing Peter Obi – Momodu
- Maurice Revealed How Crypto Ban Made Yellow Card Stronger
- Cardano, Shiba Inu Dip as BlockDAG Fuels 4,000% Hype
- FG Records 400% Surge in Hospital Visits as 47 Million Receive Life-Saving Vaccines
- Health Crisis Looms as Resident Doctors Set to Resume Indefinite Strike January 12
- Delta Catholic Diocese in Mourning as Priest Slumps, Dies While Preaching at Mass
- Visa Dream Turns Nightmare as Alleged Fraudster’s Actions Earn Nigerian Five-Year Travel Ban
- Benue Attacks: American Visitor Recovers Skeletal Remains in Yelwata Community
- Global Leaders Respond to U.S. Raid on Maduro
- Amorim Blasts Manchester United Officials After Leeds Draw
- President Tinubu Orders Security Agencies to Hunt Kasuwan Daji Attackers
- Why Nigerians Should Support The Tax Reforms
- Distinguishing between Federal Government Revenue and the Federation Account
- Trump: U.S. Forces Capture Venezuela’s President Maduro, Wife
- Wabara Debunks Defection Rumours, Affirms PDP Loyalty
- No More Free Handouts – Tonto Dikeh Draws the Line for 2026
- CBN Releases 2026 Outlook, Maps Growth Path
- Anthony Joshua’s Driver Charged After Fatal Nigeria Crash
- IMPRISONED BY AMBITION : Peter Obi’s Reckless Misreading of Politics and Power
- Nigeria’s Telecom Giants Move from Survival to Growth
- Starlink Hits 9 Million Users Globally As Nigeria Becomes its Stronghold in Africa
- Chelle Closes Super Eagles Training Ahead of Mozambique Clash
- Ranchers Bees Sign Yusuf Musa for Second Half of NNL Season
- Oluremi Tinubu Welcomes Nigeria’s First Baby of 2026 in Abuja
- A Golden Run: 2025 and the Year Nigerian Sports Found its Smile Again
- NDLEA Nabs 1,389 Suspects, Seizes Over 7.7 Tonnes of Drugs in Kano
- Tragedy in Ohio: State Reports First the first child death from Flu
- Onuigbo Endorses Tinubu for 2027, Cites Economic Achievements
- Plateau Governor Mutfwang To Join APC Today
- Uzodimma Urges Vigilance to Sustain Peace in Imo State
- De Angels Sends a Stern Warning to Those Circling Her Marriage
- Funke Akindele’s Behind The Scenes Hits ₦1B, Breaks Records
- Nigerian Equities Soar in 2025, NGX All-Share Index Up 51%
- Naira Posts First Annual Gain Since 2012, Closes 2025 at N1,429/$1
- How Verve Became the heartbeat of Nigeria Commerce
- Governor Mutfwang Set To Pick APC Membership Card
- Wike Accuses Fubara of Backtracking on Tinubu-Brokered Peace Deal
- Alex Otti to Stay in Labour Party Despite Obi’s Exit
- Nigeria to Enforce New Tax Laws as FG Pushes Revenue Expansion
- CBN Projects Stronger Economic Growth, Easing Inflation Outlook
- Sydney Talker Speaks on Carter Efe’s Move to Streaming
- Jada Pollock Criticises Acceptance of ‘Side Chick’ Culture
- Yvonne Jegede Clears Air on Annie Idibia Rumours
- “No Mother Can Be at Peace” — Regina Daniels Speaks on Custody Battle
- Nigeria’s E-Commerce Boom Creates Opportunities as bitMARTe Launches
- Microsoft and FG Train 4 Million Nigerians To Gain Tech Skills in Five Years
- 2025: Lassa Fever Deaths in Nigeria Reach 195 in December Surge
- Beyond the Hype: 5 Scientific Backed Health Resolutions for Nigerians in 2026
- NAFDAC Warns: Urgent Alert Over Counterfeit ‘Kiss’ Condoms in Nigerian Markets
- The Summits That Defined Nigeria’s Tech Ecosystem in 2025
- Anambra Becomes Third State to Adopt Harmonised Tax Reform Law
- Over N25 Billion Raised Through Oluremi @65 Education Fund
- First Lady Oluremi Tinubu Urges Nigerians to Embrace Unity and Hope in 2026
- NNPCL Posts ₦502bn November Profit Despite Lower Output
- Allwell Ademola’s Brother Slams Nollywood Stars Over Lack of Support
- Shaffy Bello Says She Avoids Long Road Trips in Nigeria
- Nasarawa Police Ban Tyre Burning During New Year Festivities
- Peter Obi Defects to ADC Ahead of 2027 Elections
- New Tax Laws to Take Effect January 1, 2026 as Planned — FG
- Tinubu Congratulates Wale Edun on Royal Victorian Order Honour
- Tinubu Appoints Rotimi Oyedepo as DPP
- NPFL Talents On Radar Of Foreign Scouts
- Telecom Operators Promise Better Service Nationwide
- Outrage Over Rumours Of Mohbad’s Wife Giving Birth Years After His Death
- Nigerian Boxers Record Wins On Global Stage
- Universities Brace For New Admission Guidelines
- Naira Holds Firm As CBN Tightens Market Oversight
- Tinubu Phones Anthony Joshua, Mother After Ogun Crash, Assures of Best Medical Care
- NSC DG Olopade Visits Anthony Joshua, Mourns Crash Victims
- Gov. Aiyedatiwa Signs N524B 2026 Budget Into Law
- Tinubu Condoles Anthony Joshua Over Lagos–Ibadan Expressway Tragedy
- Nigeria: Close Of Year Accounting Sequencing From Reform To Relief
- Anthony Joshua Injured in Ogun Crash That Claims Two Lives
- Shettima: Strong Marriages Vital to Nigeria’s Development
- Tinubu Departs for Europe, Heads to Abu Dhabi for Sustainability Summit
- Tinubu Joins Historic Return of Eyo Festival in Lagos After Eight-Year Break
- Nigeria–US Airstrike Hits Terrorists in Sokoto, No Civilian Casualties
- Bassey Reveals Near Career Exit Before AFCON 2025 Breakthrough
- Police Nab Notorious Bandits, Recover Arms and Ransom in Kwara
- CAN Hails Tinubu Over Peaceful Christmas
- SGF Akume Marries Former Ooni’s Queen Zaynab
- FG Confirms January 2026 Start for New Tax Laws
- Tinubu Applauds $1.126bn Lagos–Calabar Highway Financing
- 2025 in Review: Sunday Dare, Tinubu’s Media Shield
- Sanusi Praises Otti, Says Abia’s Progress Gaining Global Attention
- 2Baba: No Such Thing as a ‘Wack’ Artiste
- Enyimba Set to Unveil Deji Ayeni as New Technical Adviser
- AFCON 2025: Boubou Traore to Referee Super Eagles vs Tunisia
- Uyo to the Future: Lawson Hezekiah Drives Tech Education with Mita School
- Presidency Debunks Reports of Gbajabiamila’s Replacement as Chief of Staff
- Tinubu Sets Up APC Peace Committee
- Tinubu Calls for Peace, Religious Tolerance in 2025 Christmas Message
- Oluremi Tinubu Calls for Unity, Peaceful Coexistence in Nigeria
- Security Tops Agenda As FG Moves From Promises To Action
- Tough Choices, New Direction: Nigeria Unveils Sweeping Fiscal Reset
- No Drug Test, No Job: FG Sets New Rule For Public Service Recruitment
- Dangote Launches Hotline to Report PMS Overpricing
- NIN Becomes Tax ID for Individuals, CAC Number for Firms – FIRS
- Tinubu Presents National Honour Certificate to Troost-Ekong
- NAF C-130 Resumes Ferry Flight After Precautionary Landing, Crew Safe
- Uzodimma Empowers 10,000 Artisans to Boost Imo Economy
- Tinubu’s Reform Agenda Targets Stronger, More Resilient Nigerian Economy
- Doris Ogala Freed After Two Days In Custody
- Nigeria Stays 38th in FIFA Rankings
- Kwara Governor Presents ₦644bn 2026 Budget to State Assembly
- FG Declares Dec 25, 26 and Jan 1 Public Holidays
- Golden Girl, Florence Oluwadamilanre Strikes Triple Gold in Weightlifting
- Toptier Sports Management commends NSC DG Bukola Olopade as its 40 billion Naira investment set to revolutionize Nigerian Leagues
- Tinubu Renames Azare Health University After Sheikh Dahiru Bauchi
- Tinubu Commends Zulum, Commissions Projects In Borno
- Kaduna Extends Teachers’ Retirement Age To 65
- NAFDAC Bans Indomie Vegetable Flavour
- Tinubu Warns Governors on LG Autonomy Ruling
- AFCON 2025 Kicks Off in Style as Davido Headlines Opening Concert
- Police Nab Suspected Serial Rapist in Sokoto
- NPFL: 3SC Assure Fans of Safety Ahead of Tornadoes Clash
- Nigeria Tax Reforms Is Overdue
- TAX REFORMS PUSH-BACK: Opposition’s Political Gimmickry or Genuine Love for the Masses?
- Tinubu Unveils ₦58.18trn 2026 Budget, Targets Stability and Growth
- FEC Approves N58.47trn 2026 Budget, Revises Exchange Rate to N1,400/$
- NSC Salutes Ahmed Musa for Outstanding Service to the Nigerian Football
- Sunday Dare: Inflation Falls to 14.45% as Tinubu Reforms Gain Traction
- President Tinubu Reconstitutes NERC Board
- Nigeria Clinches 8 Golds in African Youth Games Weightlifting
- Olalekan Reaches Boxing Semi-Finals at African Youth Games
- Tinubu Nominates Successors After NMDPRA, NUPRC Chiefs Resign
- Malaria Transmission Falls in Lagos, FG Says Elimination Within Reach
- AFCON 2025: Nnadi Reacts to Surprise Super Eagles Call-Up
- Falana to AGF: Prosecute 10 Soldiers, 400 Terror Sponsors
- Ganduje: Why We Shelved Private Hisbah to Preserve Peace in Kano
- FG Begins N758bn Pension Bond Disbursement
- Reps Raise Alarm Over Discrepancies in Gazetted Tax Laws
- Court Orders Detention of Vessel Over Cocaine Seizure
- Nigeria’s Q3 2025 Imports Rise to N161.23tn
- Road Safety First: FRSC Issues Warning to Peller
- Team Nigeria Clinches Bronze In Judo At 4th African Youth Games
- Inside the Dangote Remarks, the Regulator, and the Presidency’s Red Line
- Senate Passes 2026–2028 MTEF, Clears Path for Tinubu’s 2026 Budget
- Mikel Questions AFCON Squad as Onyeka Targets Glory
- FIFA Unveils 2025 Men’s Best XI, Luis Enrique Honoured
- Dollar Trades at ₦1,485 at Black Market as Forex Pressures Persist
- Nigeria Earns ₦12.8tn from Crude Oil Exports in Q3 2025 — NBS
- Nova Bank Opens Regional HQ in Owerri
- Tinubu Mobilises Military Assets, Unveils New Armoured Vehicles
- Tinubu Defends Institutional Independence Amid Opposition Outcry
- Tinubu Urges Youth to Learn from Buhari’s Legacy
- Tinubu Hails Buhari’s Integrity, Legacy at Biography Launch
- Dangote Refinery to Sell Petrol at N739/Litre
- NSIB: Eight Escape Unhurt in Aircraft Incident at Kano Airport
- ICPC Recovers ₦37.44bn, $2.35m in 2025
- Lagos Bill Seeks to Ban Evictions Without Court Order
- Canada to Open Express Entry for Foreign Doctors in 2026
- Ebonyi Gov Approves ₦150,000 Christmas Bonus for Workers
- Dangote Alleges NMDPRA Chief Spent $5m on Swiss School Fees, Urges Probe
- 4th African Youth Games: Nigeria’s Medal Surge Continues
- 2025 Africa Youth Chess Championships
- Military Rescues Kidnapped Woman in Taraba
- Ayra Starr Reveals Struggles in New York
- Tinubu Approves Massive Boost to CCB Budget, Raising It to N20 Billion
- Adeboye Urges Faith in God’s Power to Transform Lives
- Uzoho Arrives Early at Super Eagles AFCON Camp
- NDLEA Arrests Suspected Drug Supplier to Bandits in Niger
- ECOWAS Leaders Gather in Abuja for 68th Ordinary Session
- Nigeria Wins 11 Athletics Medals at African Youth Games
- Nigeria’s Young Swimmers Shine at Africa Youth Games
- Lagos Assembly Passes Amotekun Law to Boost Security
- Tinubu to Transform NIPSS into Digital Global Think Tank by 2030 — Shettima
- Tinubu Congratulates Oyebamiji, Calls for Unity Ahead of Osun 2026 Poll
- Shettima Hails Uzodimma at 67, Lauds APC Leadership
- Obasanjo, Gowon, Ooni Grace State House as First Lady Hosts 2025 Christmas Carols
- Kano Govt Bans Independent Hisbah Group
- Sunday Dare: Petrol Price Drop Linked to Tinubu’s Oil Reforms
- Nigeria Wins Hosting Rights for 2027 AU Sports Council Policy Meeting
- Africa Youth Games: Team Nigeria Adds to Medal Tally
- Renewed Hope Ambassadors Drive Nationwide Awareness on Tinubu’s Renewed Hope Agenda
- Tinubu Support Group Names Magaji Da’u Aliyu Deputy DG (North)
- 4th African Youth Games: Nigeria Claims Silver in Badminton, Records Strong Performances Across Events
- Nigeria Submits Bid to Host 2031 African Games
- Hope Uzodimma: Securing The Mandate To Preach The Gospel Of Renewed Hope
- Nigeria Starts on High Note at Africa Youth Games
- First Lady Hosts Children’s Christmas Brunch
- Fani-Kayode, Dambazau Given Ambassadorial Clearance
- FCCPC Takes Action Against Ikeja Electric
- Klint Da Drunk Reveals Why He Abandoned Music for Comedy
- Nigeria Falls One Spot in New FIFA Women’s Ranking
- Tinubu Moves to Resolve Contractor Payment Delays
- 3MTT Summit: Tijani Showcases Tinubu’s Digital Impact
- Bayelsa Deputy Governor Hospitalised After Office Collapse
- Tinubu Unveils New Security–Economic Blueprint to Harness Marine Wealth
- FEC: Tinubu Orders Training, Arming of More Forest Guards
- Team Nigeria Heads to Angola for Africa Youth Games
- Tinubu: Youth Will Drive Nigeria’s Future Through Innovation and Skills
- Nigeria-U.S. Ties “Warm and Robust” – Spokesperson
- Uzodimma, Sanwo-Olu Engage CBN on Growth Strategies
- NRHA Launches Nationwide Renewed Hope Outreach
- Nigerian Equities Fall After Seven-Month Winning Streak
- Wale Edun: Imo Poised for Investment Growth
- Odey Leaves Randers After Four Years
- Piqué Lists Top Contenders Against Barcelona
- Akinsanmiro Called Up for AFCON 2025
- 82 BDCs Approved Under CBN Guidelines
- NAF Clarifies C-130 Diversion
- NUPRC: Govt Slashes Oil Licensing Bonus to $3–7m
- Odumeje Dares Pastors to Miracle Face-Off
- Nasboi Opts for Money in ‘Next Life’
- Yakubu Wins AGN Presidency Over Rita Daniels
- Tinubu: All Kidnapped Students Must Be Returned
- Neymar Plays Through Injury to Save Santos
- Cross River Declares 20-Day Holiday Leave for Workers
- NASS to Debate 44 Constitution Amendment Bills
- Two Killed in Head-On Collision on Sagamu–Benin Expressway
- TikTok Blocks Late-Night Live Streams in Nigeria
- Tinubu Praises Nigerian Forces for Thwarting Benin Coup
- Messi Praises Alba and Busquets After MLS Cup Win
- Odimayo Meets Okitipupa Stakeholders, Seeks Re-Election Support
- VP Shettima in Abidjan for Ouattara Inauguration
- NSA Ribadu Holds Security Talks with U.S. Lawmakers
- Super Eagles’ AFCON 2025 Group Rival Names Provisional Squad
- New CBN Cash Withdrawal Limits Take Effect Jan 1
- NSC, Games LOC Chair Meet on Abuja 2027
- Food Prices Fall Again Nationwide as Tinubunomics Gains Momentum
- Kenya’s Namutala, Jepkemoi Win 2025 Abuja Half Marathon
- Nigeria Will Defeat Insurgency, Says Uzodimma as He Calls for a More United Nation
- Tinubu Names New Boards for UBEC, BOA, NADF
- Dangote: Fuel Queues Over, Refinery to Lead Global Output by 2028
- Omisore, Six Others Disqualified from Osun APC Primary
- “Don’t Demarket Imo State” — Leo Stan Ekeh
- Regarding The 2025 Imo State Economic Summit
- Gen. Musa: Security is Everyone’s Responsibility
- Kukah Backs Tough Measures to Restore Security
- Tinubu Swears In Gen. Musa as Defence Minister
- Tinubu Nominates Ibas, Dambazau, Enang, Ohakim as Ambassadors
- “Imo Has Risen and Is Open for Business” — Uzodinma
- When Elders Forget Their Own Footprints, A Nation Suffers the Burden of Selective Amnesia
- Owerri Agog as Imo Economic Summit Begins
- Abuja Ready for PremiumTrust Bank Half Marathon
- Nigeria Dominates Inaugural West Africa Para Games in Abeokuta
- Tinubu Swears In New Permanent Secretaries, NPC Chairman at FEC
- FEC Approves 2026–2028 Fiscal Plan
- NEC Approves Security Funding
- Oluremi Tinubu Calls for Stronger Disability Inclusion in Nigeria
- Akwa Ibom Bans Street Masquerades
- Senate Begins Screening of Defence Minister-Designate Musa Today
- Burna Boy to Fund Funerals of California Shooting Victims
- CBN Raises Withdrawal Limit to ₦500,000
- Obasanjo Cannot Escape Blame for Today’s Turmoil — Omirhobo
- Abuja Half Marathon: Nigeria Gears Up for Elite Field
- Uzodimma Condemns Assaults on Schools, Religious Centres, Labels Perpetrators National Foes
- Tinubu Launches 2026 Armed Forces Remembrance Emblem
- Tinubu Nominates Gen. Musa as Defence Minister
- Nigeria Extends Lead at West Africa Para Games
- NSC to Approve Flag Football Federation, Elections Ahead
- Defence Minister Badaru Abubakar Resigns on Health Grounds
- Oluremi Tinubu Urges Renewed Push to End HIV by 2030
- Shettima Endorses Localised Smart Class Plan for Schools
- Yusuf Alli: Abuja Half Marathon Set for Record-Breaking Return
- Between Tinubu’s Capacity And The Ignobility Of Pseodo Statemanship
- Jonathan Returns Safely, Meets Tinubu Amid Bissau Turmoil
- Tinubu Sends 32 New Ambassadorial Nominees to Senate for Confirmation
- Tinubu Hails Nigeria’s Return to IMO Council After 14 Years
- Tinubu Sets Up National Tax Policy Implementation Team
- NSC Announces Organizing Committee for 2027 Africa School Games
- Enugu State Government nullifies underage marriage, arrest parents, groom and matchmaker
- Another milestone – Automotive Skill Upgrade and Certification Programme for Youths
- Tinubu Sets Up Nigerian Team for US-Nigeria Security Working Group
- Tinubu Declares Security Emergency, Orders Mass Recruitment
- Tinubu Appoints New Ambassadors
- SECURITY THREATS: You Are Doing Well, And We Believe You Will Do More
- Oluremi Tinubu to Global Educators: Let Humanity Lead Technology
- Shettima Returns After G20, AU–EU Missions
- Breaking: All 24 Abducted Maga Schoolgirls Rescued
- Court Orders Nigerian Army To Vacate Disputed Land In Plateau
- Sunday Dare to Deliver Keynote on Youth and Automotive Innovation in Ibadan Tomorrow
- I Won’t Relent Until All Nigerians Are Protected Under My Watch— President Tinubu
- Tinubu Names Uzodimma Renewed Hope Ambassador, DG for APC Outreach
- Nigeria Pushes Africa-Led Security, UN Veto Power at AU–EU Summit
- Nigeria Is Fighting for Its Survival and the United States Must Not Stand Aside
- South-West Governors Unveil Regional Security and Economic Plan
- Nigeria, US Strengthen Security Partnership Following High-Level Talks
- RHAN: Tinubu’s Security Reforms Deliver Major Gains
- Abeokuta Set for Historic West Africa Para Games
- D’Tigers Hit Tunis for 2027 World Cup Qualifiers
- 2Baba, Edo Lawmaker Natasha Osawaru Welcome First Child
- Tinubu Withdraws Police From VIP Protection
- Tinubu Convenes Emergency Security Meeting
- Shettima Heads to Angola for AU-EU Summit
- Nigeria Makes Historic Debut in IBSF World Cup 2-Woman Bobsleigh
- Tinubu Announces Rescue of Kwara Worshippers, 51 Niger Students
- Nigeria Breaks Record with 30-Medal Islamic Games Finish
- Tinubu Urges Fair Mineral Trade, Ethical AI, and Financial Reform at G20
- Shettima To Represent Tinubu At G20 Summit In South Africa
- Abeokuta Set for Historic West Africa Para Games as 10 Sports Debut in 5 Days
- Adewale Leads Lagos APC E-Registration Push
- Odimayo Emerges as a Defining Force in Grassroots-Focused Leadership
- From U.S. Alarm to Tinubu’s Validation
- Tinubu Halts Foreign Trips as Surge of Attacks Sparks Urgent Security Push
- Schoolgirls Abducted: Tinubu Deploys Matawalle to Kebbi
- FAAC Allocates N2.094trn to FG, States, LGs
- Banks Notify Customers as FIRS Enforces 10% Withholding Tax on Fixed-Income Interest
- CBN Warns Public Against Zuldal MFB
- Riyadh 2025: Nigeria Adds Two More Gold Medals
- Congressman Moore Meets Nigerian Officials on Security
- Tinubu Approves Redeployment of 16 Permanent Secretaries
- Tinubu Delays Summits, Orders More Troops To Kwara
- Jigida Queen Tells Lawyer Giwa to Face Court, Stop Media Spin
- Nwoko Rules Out Reconciliation, Says Regina Needs Therapy
- VDM Apologises After Mid-Air Clash With Mr Jollof Disrupts Asaba–Lagos Flight
- Nnaji Rejects Stereotyping of Igbo Women Online
- Hakimi Wins 2025 African Player of the Year
- G20: President Tinubu looks beyond Geo-Politics towards a global economic reset that reflects Africa’s strategic value
- Congratulations, Minister Wike – Dr. Muiz Banire
- Tinubu Sends Shettima to Kebbi, Vows Swift Rescue of Kidnapped Schoolgirls
- Shettima: Tinubu’s Reforms Unlocking Major Investment Opportunities
- Tinubu: Reforms to Boost Youth Competitiveness
- APC Postpones Kefas Reception After Kebbi Schoolgirls’ Kidnap
- Tinubu To Embark On G20, AU-EU Mission
- First Lady Salutes Security Efforts, Receives Chiefs’ Wives
- 25 Kebbi Girls Kidnapped, Vice Principal Killed – First Lady Reacts
- Understanding Hotel Event Pricing Key to Avoiding Hidden Costs
- Nigeria’s Inflation Drops to 16.05% in October 2025
- Okon-George Leads Nigeria Into Three Finals at Riyadh 2025
- Four Nigerians Make Final CAF Awards Shortlists
- Ibrahim Chatta Charges ₦5 Million Per Day in Nollywood
- Abideen Hits Brace as Fomget Rout Unye Kadin 8–0
- Balikwisha Rejects ‘Voodoo’ Claims After DR Congo’s Win Over Nigeria
- Nigeria Confronts Growing Threat of Misinformation
- Prince Edward Visits President Tinubu in Abuja
- Tinubu Warns Fragmented Markets Threaten Trade
- Over 2,800 Runners Register as Abuja Half Marathon Enters Final Countdown
- INEC Releases Full Timetable for 2027 General Elections
- Tinubu Opens 2025 Judges’ Conference, Vows Stronger Judicial Reforms
- Tinubu Steps In: Military Veterans Get Long-Awaited Pension Arrears After Peaceful Protest
- 2027: Peter Obi Poised to Rejoin PDP as Party Commits to Southern Zoning for Presidential Ticket
- New DGSS Assumes Office
- Farewell to a Titan: Nigeria Mourns the Passing of Edwin Clark
- The Delta Exodus: A Wake-Up Call for PDP?
- Tinubu Declares “The Worst Is Over” as Nigeria Marks 65 Years of Independence
- 18 Africans Among 135 Cardinals Eligible to Elect Next Pope
- FG Scrambles as N4 Trillion Debt Pushes Power Sector to the Edge
- AFCON Drama: CAF To Rule On Lybia VS Nigeria Showdown After Chaotic Qualifier
- Nigerian Education Loan Fund Disburses 2.5bnTo 22,120 Students
- Tinubu’s Bold Plan: How Livestock Investment Could End Farmer-Herder Conflicts And Hunger In Nigeria
- A House Divided: The Untold Story Behind Dajoh’s Fall
- First Bank Set to Build Nigeria’s Tallest Tower—A Game-Changer for Banking and Lagos Skyline
- Energy Monopoly Showdown : Oil Marketers Fight Dangote Refinery’s Bid To Control Nigeria’s energy Sector
- Nigeria’s Multi-Million Dollar Plan to Revolutionize Public Broadcasting
- Ngũgĩ wa Thiong’o, Iconic Kenyan Author and Activist, Dies at 87
- PRESIDENT TINUBU DEPARTS ABUJA TO BEGIN 2025 ANNUAL LEAVE
- Lagos State Sports Commission upholds Dissolution of Senior Team Lagos, Warns Impostors Parading as Lagos Athletes
- AfroBasket 2025: D’Tigers Crush Defending Champions, Tunisia to Record Second Group Win
- Tinubu, Sanwo-Olu Laud Doctor’s Guinness Achievement
- FG Approves N758 Billion to Pay Off Pension Debts—Here’s When Retirees Will Get Paid
- Wike Vows To Continue Abuja Demolition Despite protests, Says No Amount Of Blackmail Will Stop Us
- A Decade of Excellence: Celebrating 10 Years of the Access Bank Lagos City Marathon
- Lawmaker Alleges Corruption and Threats in House of Representatives Committee Probe
- Muhammed Babangida Embraces BOA Role, Debunks Rejection Rumors
- December 2024 Revenue Drop: FG, States, LGAs Share N1.424 Trillion Amid Economic Shifts
- BOMB THREAT in Canada: Operations back to normal after multiple Canadian airports hit with bomb threats
- Budget at Risk: Nigeria Misses 2025 Oil Production Target as Prices Slide Below Benchmark
- APC National Chairman Visits Plateau seeks spiritual and royal blessings
- Meet Sunday Akin Dare: President Tinubu’s New Special Adviser on Public Communication and Orientation.
- Nigeria Pledges Additional $500 Million to AfDB’s Nigeria Trust Fund
- President Tinubu Joins Global Leaders in UAE for Abu Dhabi Sustainability Week
- OBITUARY: Aminu Dantata, Kano billionaire businessman who owned lands ‘all over the world’
- Old Naira Notes Still Legal Tender: CBN Sets the Record Straight Amid Cash Scarcity
- RENEWED HOPE WARD DEVELOPMENT PROGRAM
- China Joins Forces with Nigeria to Power $20 Billion Ogidigben Gas Project
- Suspension Holds as Senate Recesses: Natasha Akpoti-Uduaghan Locked Out Until September Abuja
- Africa’s Tourism Sector Set to Create 80 Million Jobs in a Decade – CBAAC
- 39 Killed in Abuja, Anambra Stampedes
- Lookman’s Win No Surprise — NSC DG
- Tinubu’s Reforms, Adeola Gaffe: Key Takeaways
- Tinubu’s 2025 Agenda Unpacked
- Musk Introduces Party to Challenge GOP, Democrats
- Oyebanji Backs Tinubu as Boldest Hope
- Zenith Bank’s Dividend Payout Delights Shareholders
- Appeal Court Reinstates ACP Idachaba, Fines Police ₦2m
- Corps Members Set to Get N77k Backlog
- Dr Victor Omololu Olunloyo: Uncommon Brilliance
- NSC Boss Praises Gov Mbah’s Strides
- AFDB Trains Covenant University Students in Data Skills
- El-Rufai Expelled by SDP, Banned for 30 Years
- UNIMAID ASUU Calls Buhari Renaming “Provocative”
- Political Drama in Rivers: Budget Uncertainty as Assembly Adjourns Indefinitely
- Nigeria Customs Service Launches 2025 Recruitment Drive
- Robots Deployed to Prevent Bridge Collapses
- Food Security and National Development in NW Nigeria (2015–2023)
- Akpabio Speaks on Senate Harassment Allegations
- Fuel Frenzy: South Africa And 6 Other Nations Queue For Dangote Refinery’s Fuel Supply
- Tinubu’s Nigeria Defies the Naysayers—Global Investors Are Taking Notice
- FGN URGES ASUU TO SHELVE STRIKE IN THE INTEREST OF STUDENTS, VOWS TO INVOKE NO WORK, NO PAY RULE
- Eastern Rail Rebirth: $3B Secured as Senate Approves Tinubu’s $21B Global Loan Package
- CSOs Are the Backbone of Democracy – Presidential Aide Sunday Dare Declares
- Signs of Recovery? Naira Begins to Stabilize as Oil Production Rises
- Foreign Fighters Fueling Terror: DHQ Blames Influx for Northwest, Northeast Attacks
- Cash Crunch Chaos: Nigerians Struggle as Banks Ignore CBN Orders Amid Yuletide Rush”
- Sadiq Khan Hails Lagos as ‘Africa’s Cultural Capital’ as He Launches First Trade Mission to Africa Lagos, Nigeria
- Tinubu Names Shamseldeen Ogunjimi as Acting Accountant General Amid Treasury Reform Agenda
- PDP Mulls Peter Obi, Jonathan for 2027 Presidential Ticket – Gov Bala Mohammed
- Chiamaka Nnadozie- A Goalkeeper On Another Level Of Qualities And Greatness
- Nigeria Surpasses OPEC Oil Quota as Inflation Dips to 22.22% in June
- FG Sign Massive $328.8 Million Power Deal with China.
- ACADEMIC STAFF UNION OF UNIVERSITIES REJECTS FG LOAN SCHEME, CALLS FOR IMPLEMENTATION OF AGREEMENTS.
- WE’RE BETTER OFF TOGETHER, PRESIDENT TINUBU TELLS MALIAN LEADER
- Forging Ahead: The Evolving Nigeria-South Africa Alliance
- President Tinubu Drives AKK Gas Pipeline to 83% Completion, Set for November 2025 Milestone
- Mass Deportation Shocks Illegal Immigrants in Nigeria
- How to Get FG’s CALM Fund Loan for CNG Conversion & Solar Power—No Collateral Required
- NSC DG Hon. Bukola Olopade Graces Isimi Lagos Festival, Says NSC Will Support Private Sector-Driven Sports Development
- House Of Reps Set For Explosive Showdown Over Tinubu’s $2.2bn Loan Request: Will It Pass Or Spark Chaos
- NCS Generates N1.75 Trillion in Q1 2025 Revenue
- Regina Daniels Drops Bombshell: Don’t Let Your Boyfriend Stop You From Meeting Your Husband Sparks Reactions
- Tragedy in Sokoto: Nigerian Government Promises Probe Into Deadly Airstrike That Killed Civilians
- Apologize and Return? Akpabio’s Media Aide Says Suspended Senator Natasha Holds the Key to Her Own Comeback
- CBN Shakes Up NIRSAL Leadership, Sacks Executive Directors
- JAMB Orders Re-Exam for Nearly 400,000 Students After 2025 UTME Tech Glitch
- Nigeria Introduces Utapate, A New Low-sulfur Crude Grade
- Unveiling The Shadows Of Corruption In NNPCL
- One year later, what value has Tinubu added to our lives? – 1
- EFCC Uncovers Chinese-Led Cybercrime Syndicate: Shocking Details of Abuja Raid
- FG Eyes Fresh $1.75bn World Bank Loan Despite 40% Revenue Surge
- How Top Government Agencies Are Secretly Violating Federal Character Rules
- FG, FAO Unveil N200 Million Initiative to Boost Fish Farming and Cut Imports
- Warri-Itakpe Train Service Returns After Setbacks — Now Running 6 Days a Week”
- Chief Sunday Dare Congratulates Dr Saka Balogun, On His Appointment As Balogun Of Ogbomoso land.
- ECA Urges Bold Action to Transform Africa’s Food Systems
- Election Storm In Ondo: Shettima, APC In Final Push As PDP Cries Rigging Plot
- FG Pledges 14-Month Completion of Abuja-Kaduna-Kano Road Upgrade: What You Need to Know
- Professors on Peanuts: ASUU Warns of Fresh Strike as Varsity Pay Crisis Deepens
- Kaduna And Zaria Erupt In Chaos As Protest Intensify, N700bn Lost In 5 Days
- Activist Arrested Ahead of Anti-Police Protest: Inside the Drama Over Planned Demonstration Against IGP Egbetokun
- Governor Dapo Abiodun Adorns Name “Omobowale” on Two-Time World Heavyweight Boxing Champ, Anthony Joshua, New Boxing Hall Named After Him
- Court Orders Army General to Forfeit N5bn Shares in 17 Companies
- Tinubu’s Surprise Palliative Gift to Christians & Muslims in South-East, South-South
- Fears of Nationwide Protest Triggers Fuel Scarcity.
- Military Intercepts 3 Drone Strikes, as BH Upgrades Warfare.
- 2Face’s ‘African Queen’ Crowned No. 1 on Billboard’s Afrobeats All-Time Songs List
- Tinubu’s Bold Housing Move: Why Town Planners Are Applauding His Latest Appointment
- El-Rufai’s Political Capital Crashes: Mahdi Shehu Warns Opposition Against “Suicide Alliance”
- INEC Launches AI Division to Transform Nigeria’s Electoral System
- Nigeria to Launch Massive Space-Tech Training for Youths – 200,000 to Benefit Annually
- Expert predicts Naira Comeback As CBN Slashes Customs Duty Rate
- Nigeria to Host 2027 African Schools Games After Successful Bid
- Ahead of Crucial World Cup Playoffs: What the Super Eagles’ Journey Means for Nigeria
- Abia NMA Slams FG’s Pay Circular, Backs Nationwide Ultimatum
- Downstream Deregulation: Between Obasanjo’s Half-measures And Tinubu’s Bold Leadership
- 14 Days to Go: Ogun State Ready to Host Nigeria’s Biggest Sports Festival Yet
- Ireland’s Good Friday Agreement replicated in Nigeria? What do you think?
- Falana Rejects Planned Protest– ” I will not join the protest. The Leaders are faceless”
- Matawalle – Nigeria’s Civilian General still at Work
- Why FG Hasn’t Started Direct Allocation to Local Governments
- Desperate Struggles: How Borno’s Refugees Are Battling Survival in Kano’s Shadows
- Tinubu’s Bold Plan: Stabilising West Africa and Uniting Africa’s Troops Through Camaraderie and Fitness
- Tinubu’s Road Revolution: Umahi Unveils Major Infrastructure Push in Southeast
- The SkillUp Imo Project is not just ambitious — it’s visionary. A bold, strategic leap into the digital future. Its target of upskilling 50,000 young people in key digital competencies has been fully realized.
- **Kenya’s Edwin Kibet Wins 10th Access Bank Lagos City Marathon in Stunning Fashion**
- What rising oil prices mean for Nigeria’s fiscal position, stable naira
- Osimhen Scores Twice To Lead Galatasaray Win, Dedicates Goal To Injured Icardi
- Lagos Set to Welcome International Athletes for 10th Access Bank Lagos City Marathon
- Sunday Dare appointed as Special Adviser to the President on Public Communication and Orientation
- NIGERIA’S NON-OIL REVENUES POWER STRONGEST FISCAL PERFORMANCE IN RECENT HISTORY
- Subversive Elements and Genuine Suffering: Unpacking the Complexity of Nigeria’s Protests
- Jonathan Laments Culture of Betrayal in Nigerian Politics
- Tinubu Assembles Top Industry Experts with Stellar Reputations for NNPCL Board
- Court Ruling Clears Jonathan to Contest Presidential Election Again
- Kubwa, Abuja building collapse casualties unknown
- THE 15 PERCENT ON PETROL AND DIESEL IMPORTS- A BRIDGE. NOT A BURDEN.
- Tinubu Not Settling Tribal Scores
- Federal Gov’t Flags Off TVET Entrance Exam Into Tech Colleges For 30,000 Students
- Nationwide League One Approves Black Scorpions FC’s Relocation to Abuja
- Tax Reform Tug-Of-War: How Nigeria’s VAT Battle Could Reshape The Nation’s Future
- NATIONAL SPORTS COMMISSION
- Olugbon’s Regrettable Stance On Ogbomoso Imam Tussle
- Rivers State Governor Siminalayi Fubara Reflects On Overcoming Impeachment Plot
- Bola Tinubu : A President Ready To Risk It All For Future Generations
- Kayemo Exposes Major Air Travel Secret: Oyedepo’s Jet Can’t Take Off Without Proper Approval
- Attom Foundation Brings Barça Legends and African Legends to Abuja for Champions Cup*
- Nigerian Civil Servants To Receive Enhanced Salaries After Minimum Wage Adjustment
- Cabinet Shake-up : Tinubu’s Bold Moves Spark Division Between Private Sector And Opposition
- 123 Million Liters Of Petrol Imported As Marketers Race To Meet Demand Amid Dangote Refinery Shortfall
- 70 Dead, 57 Injured in Devastating Tanker Explosion”
- World Para Powerlifting Championships: Nigeria Moves to Second on Medals Table, as Esther Onyeama Strikes Double Gold
- Nigeria Records 39 Mpox, 5,951 Cholera Cases
- PRESIDENT TINUBU’S STATEMENT ON THE PASSING OF HIS MAJESTY OBA SIKIRU KAYODE ADETONA, THE AWUJALE OF IJEBULAND
- Nigeria to Participate in Maiden African School Games in Algeria*
- Trump’s Tariffs Won’t Hit Africa Hard, Says WTO DG Okonjo-Iweala
- Dubai-Based Human Trafficker Nabbed in Abuja After Years on the Run
- Kingsley James Awodi Honored with Prestigious Sportsville Award
- Food Crisis: Register Online For N40,000 Rice– FG Tells Public Servants t
- Tinubu Warns: Lake Chad Region Must Unite or Risk Chaos
- Fundamentals About “State of Emergency” Declared on Nigerian Oil and Gas by NNPC
- NIGERIA’S SPORTS REVOLUTION: THE UNPRECEDENTED ₦78 BILLION BUDGET THAT IS SET TO USHER IN FRESH SPORTS DISPENSATION
- Meet Mallam Musa Kida. Newly Appointed Chairman of the NNPC BOARD.
- Nigeria’s Rebased GDP Hits ₦373 Trillion—Now Africa’s 4th Largest Economy
- Davido, Tems, Rema Shine at 17th Headies Awards
- No Place for Xenophobia in Ghana, President Mahama Assures Nigerians
- Nigerians to Pay More? SEC Moves to Tax Cryptocurrency Transactions with New Rules
- Big Tax Breaks Coming: FG To Offer 50% Tax Relief For Companies Boosting Workers Pay
- (50)
- NSC DG Hon. Bukola Olopade Calls for Greater Collaboration in Nigerian Sports Sector, Felicitates With Christians on Christmas Celebration
- AANI Lagos mourns President Buhari
- Tinubu: Northern Development Is Key To Nigeria’s Success, Youths Are Our Present And Future
- Ended Fuel Subsidy to Save Nigeria’s Future– Tinubu Declares as He Rallies Youths for National Development
- Lagos Government Uncovers 176 Unauthorized Estates, Issues 21-Day Compliance Ultimatum
- CAF Reconsiders Rules As Judgment nears I’m Lybia-Nigeria Airport Saga: Will Sanctions Be Imposed?
- Ex Sports Minister Dare Offers Condolences to Babangida Family After Tragic Accident
- Tinubu to sign tax reform bills Thursday
- Presidential Adviser, Sunday Dare, CON, Says Nigeria’s Economy is responding well to President Tinubu Reforms and the Signs cannot be ignored
- FG Cracks Down on Abandoned Oil Assets
- Storm Over Shehu Buba: Terror Links, Church Demolition, and Sectarian Tensions Rock Senator’s Image
- New British Prime Minister Starmer and Challenges Ahead
- Lagos Hits Record Highs: 3.5 Million Children Vaccinated for Measles, 20.3 Million Residents Protected Against Yellow Fever in 2024
- FG Stops Sagamu-Iperu Road Project Over Poor Workmanship — Umahi Issues 7-Day Ultimatum
- Food Importers Must Sell 75% Of Items At Approved Markets, Says Customs
- World Bank Under Fire: Shehu Sani Accuses Institution Of Prolonging Nigeria’s Economic Hardship
- Court Nullifies Benue Chief Judge’s Removal, Rebukes Governor Alia and State Assembly
- Done Deal: Flying Eagles Forward Kparabo Ariheri Signs Pre-Contract With Norwegian Club Lillestrøm Sportklubb
- Shape Up or Ship Out: Akpabio Warns Senate Committees Over Poor Performance
- Honourable Sunday Dare Hails Nigeria’s Journey Of Unbroken Democracy, Commends President Tinubu’s Visionary Leadership
- NATIONAL SPORTS COMMISSION PRESS AND PUBLIC RELATIONS UNIT
- Democratic Silence On Kamala Harris Speaks Volume.
- Edo Government Slams Governor-elect Okpebholo: Focus On Your N5bn Inauguration, Not Obaseki
- FG Joins Forces with UK in Groundbreaking Digital Security Pact
- 10 ways the Tax Bills will make states richer
- Power Shift: North-Central APC Bows to Tinubu, Ganduje in Stunning U-Turn
- PDP Weighs Automatic 2027 Presidential Ticket for Jonathan Amid High-Level Talks
- Ex-Lagos Speaker, Aide Discharged of Lingering Money Laundering Suit
- Tinubu Assembles Top Brass, Ex Governors To End Benue Killings.
- NSC DG Warns Super Eagles B Against Complacency Ahead of Crucial Clash Against Ghana
- A Final Farewell in Daura: Stories, Tributes, and the Quiet Legacy of Muhammadu Buhari
- Tinubu Tax Reforms Bills Debates A Beauty Of Democracy
- PRESIDENT TINUBU RETURNS TO ABUJA FOLLOWING AQABA PROCESS MEETING IN ROME
- FG Approves Expansion Dredging at Lekki Deep Seaport to Boost Vessel Capacity
- Shocking: police Officers Caught Protecting Foreign Hackers On Illegal Duty, Says IG
- A Truly Honourable Man at 69! When his name appeared on the list of ministerial nominees, the natural assumption was that he would head the Ministry of Information. That assumption was not misplaced.
- Tinubu’s Tax Reforms: A Threat to Northern Prosperity? Gov Zulum Sounds the Alarm
- Saraki, Ned Nwoko Weigh In: Reactions Trail Delta State Governor’s Defection to APC
- PDP Slams Peter Obi Over One-Term Presidency Promise
- NSC Mourns the Passing of Legendary Super Eagles Goalkeeper, Peter Rufai
- from the Pulpit to the Pit: Governor Alia and the Blood-Stained Silence of Benue
- PDP Governors Decry Militarisation of By-Elections, Warn Against Plots to Derail Convention
- PRESIDENT TINUBU APPOINTS MUHAMMAD BABANGIDA CHAIRMAN OF THE BANK OF AGRICULTURE, OTHERS AS CHAIRMEN AND HEADS OF GOVERNMENT AGENCIES
- WITHDRAWAL OF REGISTRATION CERTIFICATE OF THE NATIONAL YOUTH COUNCIL OF NIGERIA (NYCN)
- IBB Breaks Silence on Executing Childhood Friend: ‘It Was Him or Nigeria’—Vatsa’s Family Demands Justice”
- Team Nigeria Jets Out to Annaba, Algeria for Inaugural African School Sports Championship
- NSC Explores Sustainable Private Sector Driven Funding Models For Greater Sports Development
- Former Minister Sunday Dare Hails President Tinubu’s N2trn ESP.
- Sanusi Lamido Speaks Truth to Power: Tinubu’s Economic Reforms Are Nigeria’s Only Hope*
- Breaking! NAFDAC Storms Enugu Market – Seals Fake Alcohol Shops, Advise Nigerians on Food Storage
- National Assembly Set to Pass Tax Reform Bills This Week
- ASUU ISSUES NOTICE OF INDUSTRIAL ACTION By Yemi Kosoko
- Sahel On The Brink:Nigeria Faces Growing Threats Amid Regional Instability
- How CBN Saved Nigeria from 42.81% Inflation Disaster – Cardoso Reveals Shocking Figures”
- Nigeria to Unmask Terrorism Financiers Soon – Defence Chief
- Tin City Warms Up for President Tinubu as North Central Embraces Renewed Hope
- FG to Cement Makers: Slash Prices To 7000 Or Face the Heat
- Federal Government Unveils Multi-Million Dollar Fund to Power Nigeria’s Creative Sector
- A Nigerian Marshall Plan Is Needed Today
- Senate Gives Green Light to Tinubu’s $21 Billion Global Loan Deal, Paves Way for 2025 Budget Rollout
- ACF: Time For Work, Not Distractions. Tinubu unstoppable
- PRESIDENT TINUBU NOMINATES NEW CEO, COMMISSIONERS FOR NERC
- Nigeria’s Ambassadorial Void: Tinubu Prepares To Appoint Envoys Amid Diplomatic Uncertainty
- Federal High Court Declares Lakurawa Sect a Terrorist Organization in Landmark Ruling
- DG NIA Tenders Resignation
- President Tinubu Joins Leaders in Tanzania for Game-Changing Energy Summit
- RESPONSIBLE CRITIQUE REQUIRES FACT-DRIVEN NARRATIVES
- ASUU Vows Legal Battle Over UNIMAID Renaming: “This Is a Violation of Our Identity”
- Olukoyede Orders Investigation Of N15million Bobrisky’s Allegations Against EFCC Officers
- Dj Cuppy’s Marriage Wishlist: ‘Seek God Before You Find Me’ Sparks Online Debate
- NLC Rejects Proposed Salary Hike for Political Officeholders, Calls It “Insensitive
- Tinubu Leads as ECOWAS Confronts Regional Crises at 66th Summit
- ALAKE, AFRICAN MINING MINISTERS PLAN TOUGHER RULES FOR VALUE ADDITION
- Sunday Dare Inspects NASENI’s Scientific Efforts
- GOVERNOR AIYEDATIWA CONSTITUTES MANAGEMENT COMMITTEE FOR ONDO STATE FOOTBALL AGENCY
- FG Launches Bold Plan to End Maternal Deaths in Nigeria
- Judicial Firestorm: Afe Babalola Moves to Block Bestseller Exposing Alleged Courtroom Manipulations
- Attack on Free Speech or Justice Served? Atiku Demands Immediate Release of Dele Farotimi
- Security Agents Rescue 20 Abducted Medical Students, Kill Suspected Kidnapper
- PRESIDENT TINUBU EULOGISES SON, SEYI, AS HE CLOCKS 40
- Kaduna Tanker Collision Sparks Explosion, Four Hospitalised
- BUHARI’S LEGACIES WILL CONTINUE TO INSPIRE. – Chief Bisi Akande.
- Bloody August: Amnesty International Accuses Nigerian Police Of Killing 24 Protesters In Crackdown
- Jigawa Assembly Approves Powerful Hisbah Board Law—Here’s What It Means for Residents
- 5 Million Students in Lagos to Get Laptops and AI Training in $1 Billion Digital Revolution
- FG Finally Pays November Salaries After Unexplained Glitch
- BREAKING NEWS: Chanchaga Local Government Chairman Suspended by Legislative Council
- FG Says Lagos-Calabar Coastal Highway Can Withstand Floods for 50 Years
- Sticks Can’t Stop Terrorists” — Ndume Demands Armed Community Defence After Borno Massacre
- PRESS RELEASE Niger Delta Sports Festival Opens in Grand Style, NSC Hails Effort as aligned to RHINSE Initiative
- 48-Hour Showdown: Lawmakers Threaten to Cut Funding for NPA, NIMASA, FIRS, and Other Defiant Agencies
- Anthrax Alert: Deadly Outbreak Hits Zamfara, Nigerians Urged to Stay Vigilant
- NGF Condemns Deadly Attacks in Benue State, Stands in Solidarity with Victims
- Nigeria Joins BRICS as a Partner Country
- Nigeria-Ghana Row: Calm Amid Storm as Ministers Tackle Deportation Rumors
- Fuel Relief for Nigerians: Petrol Prices Drop as IPMAN Partners with Dangote Refinery
- As President Tinubu Takes charge. Rivers Gets a shot at Peace
- Former Minister Sunday Dare Pays Tribute To Soun Of Ogbomosho Land
- She Thrives On Toxicity – Uche Ogbodo Blasts May Edochie And Her Fans In Fiery Rant
- Dangote’s Refinery Dream : A Bitter-sweet Victory For Nigeria’s Economy
- “You Can’t Be Trusted” – Presidency Slams Peter Obi Over One-Term Pledge
- FCT Workers Mobilise For Mass Action Over N70,000, Wage Delay.
- “North Leads in Student Loan Applications as FG Begins Disbursement”
- President Tinubu to Address Nigerians in Landmark June 12 Speech
- Tinubu Declares Economic Turnaround at Ramadan Iftar
- ABU Zaria Secures €5M Grant to Pioneer AI-Powered Microscope for Disease Diagnosis
- BREAKING: Presidency denies finance minister’s alleged N105,000 minimum wage proposal
- Asaba 2025: Delta State Set to Host National Youth Games from August 29 – Sept. 6
- Tinubu Honoured with Lifetime African Achievement Award at Grand Ceremony in Ghana
- FG Terminates Benin – Sapele – Warri Road Contract.
- NNPC, Akwa Ibom, GACN Seal $3.5 Billion Deal to Drive Gas
- One year later: what value has Tinubu added to our lives? –2
- Solid Minerals MoU: France Not Taking Over Nigeria – Presidency
- NiMet Warns of Dust Haze Threats to Flights and Drivers”
- Quiet Cracks: Inside the rumoured Tinubu–Shettima rift
- FG Races Against Time to Rebuild Collapsed Taraba Bridge
- Navy Bolsters Sea Defenses: 1,814 New Recruits Join the Fight Against Piracy
- EFCC Declares Four Wanted Over Alleged CBEX Fraud
- FG Deploys Drones for High-Tech Digital Mapping of Abuja
- NIGCOMSAT Unleashes Space-Tech Hackathon for North-East Youths
- NSC DG, Hon. Bukola Olopade Felicitates with Muslim Faithfuls on Eid-el-Fitr
- Buhari Congratulates Tinubu on One Year in Office, Urges National Unity and Support
- Akpabio: Nigerians Reclaimed Democracy Through Struggle, Not Military Benevolence
- TRUTH BE TOLD , FINIDI IS NOT READY FOR THE SUPER EAGLES JOB
- The Weak and the Liar: A Tale of Two Presidents on the Road to 2024
- Lagos Govt Rushes to Fix Open Manhole After Viral Outcry
- Ibadan Airport Set to Launch International Flights by June 2026
- Nigeria’s $50 Billion Space : Can Satellites Unlock the Country’s Economic Future
- Solomon Dalung: How I was abandoned by hospital for four hours over non-payment of deposit
- FCTA Intensifies Abuja Cleanup, Warns Against Shielding Criminals Under Military Cover
- Dangote Pushes For Fuel Independence As Tinubu Summons Key Players In Nigeria’s Energy Crisis
- Lagos Begins Construction of West Africa’s Largest Psychiatric Hospital to Tackle Gambling Addiction
- JUST IN: NDLEA promotes 5,042 officers, Marwa presents 70 personnel, others with special awards
- Tinubu Orders Revocation of Illegal Lagos Land Approvals as Federal Probe Expands
- Tony Elumelu Foundation Empowers 3,000 African Entrepreneurs
- NSC Showers Praise on Eniola Bolaji and the Badminton Federation After Gold Medal Triumph*
- President Tinubu’s Commitment to Sports Development Delivering Results at the Grassroots Level — NSC Chief Olopade
- Team Nigeria school sports contingents arrive home after impressive outing at inaugural school sports games
- Ademola Lookman Scores Again, Leads Atalanta To Road Victory Against Stuttgart
- Building Digital Momentum: Progressive Digital Media Summit- Sunday Dare
- NewsBudget: We’ll ensure no part of Nigeria is neglected – NASS
- APC NEC convenes July 24 to decide Ganduje’s successor
- FG to hold manufacturers, importers responsible for plastic pollution
- Nigeria Eyes 21% GDP Boost from Digital Economy by 2030 — Minister Tijani
- FG has legal backing to operate multiple budgets — Budget Office DG
- Equal Opportunities or Empty Promises Senate Targets Agencies Ignoring Federal Character Law
- FG Unleashes $350M Lifeline for Nigerian Shipping Firms After 20-Year Wait
- Arrest After Evidence: AGF Advocates FBI-Style Investigations For EFCC, ICPC
- Dirty Cash Scandal: How Policemen Stole N43.16M from Smuggled Banknotes
- FG Unveils Plan For Seven New Dams In South-West To Boost Food Production
- First Lady Raises Alarm: Urgent Action Needed Against HIV/AIDS and Female Genital Mutilation
- State Creation Frenzy: Reps Extend Deadline Amid Surging Demands
- FIGHT AGAINST TERRORISM NIGERIA STEPS UP MILITARY CAMPAIGN
- NDDC Alerts Public To Fraudulent Youth Internship Scheme Scam
- Kogi’s N110 Billion Scandal: Ex-Governor Yahaya Bello Arraigned And Remanded By EFCC
- Drug Kingpin’s Empire Crumbles: NDLEA Hunts Four Key ‘Barryshine’ Cartel Members
- The Financial Times Misses The Mark Again!
- Nigerian Government Evicts Illegal Miners After Fresh Lead Poisoning Outbreak in Zamfara
- Revolution Decay and the Historic Challenge of the Africa National Congress of South Africa
- *NSC’s Busy Sporting Calendar Showcases Nigeria’s Rising Global Presence*
- The Power Struggle Behind TheThrone: Who’s Really Gunning For Gbajabiamila?
- The IG is On top of his Game. Lets Back him.
- PRESIDENT TINUBU APPOINTS OBIH, AKINFELEYE INTO GOVERNING COUNCILS OF UNIVERSITIES, NAMES PRINCIPAL OFFICERS FOR FEDERAL UNIVERSITY OF HEALTH SCIENCES, TSAFE
- Chairman Dikko Welcomes Bukola Olopade to NSC, Says New DG Will Further Drive the Vision of the Commission
- Appeal Court Reinstates Asset Freeze on Properties Linked to Yahaya Bello
- Drama Unfolds at PDP Headquarters as Police Intervene in National Secretary Clash
- FG Unveils Bold Plan to Create 2.5 Million Jobs
- SMEDAN Secures N11bn for SME Support, Creates Over 100,000 Jobs in Two Years
- Two million children remain out of school, says UNICEF
- Port Harcourt Refinery Starts Operations – A Game-Changer For Nigeria’s Energy Future!
- Manufacturing Leads the Charge as Nigeria’s VAT Collection Surges to N1.78 Trillion in Q3 2024
- Yoruba Leaders Urge Makinde, Adeleke to Intervene in Alaafin–Ooni Rift
- Jonathan to Keyamo, Odinkalu: Stay Away from My Political Journey
- 2 Weeks to Go: 43 Countries, 937 Athletes and Officials Set for 3rd African U18/U20 Athletics Championships in Abeokuta
- 2027: Opposition Parties Clash with INEC over Voter Registration Figures
- Datti Baba-Ahmed Demands Probe into El-Rufai’s Explosive Claim on FG Payments to Bandits
- Mission 5 in a Row: D’Tigress eyes Record Breaking win over Senegal in Afrobasket Semis in Abidjan
- Why Is Nigeria Still Borrowing Despite Surging Revenues ? National Assembly Questions Tinubu’s Surging Loan Requests
- Naira Stabilizing, Food Prices Dropping—Shettima Highlights Tinubu’s Economic Wins
- With the UK currently in the middle of a general election campaign, Nigeria should have tried to influence the foreign trade debate and shift the emphasis away from the xenophobic rhetoric of limiting immigration
- PRESIDENT TINUBU DIRECTS IMMEDIATE REVIEW OF SECURITY OPERATIONS IN KATSINA, ASSURES OF STATE POLICE, FOREST GUARD UPGRADE
- FG Lights Up Yobe Teaching Hospital with 400kW Solar Power
- Tinubu Kicks Off 2024 Africa Millitary Games In Abuja: A Call For Unity Through Sports
- Media Mogul Nduka Obaigbena Blacklisted: Court Orders Banks to Freeze $225M Over $718M Debt Scandal”
- Africa’s Richest Man Set to Build Nigeria’s Largest Seaport & 6Mta Cement Plant in Ogun
- Gov Sani Has Never Been My Friend, Says El-Rufai
- DIGITAL REVOLUTION AND CONNECTIVITY TAKES OFF IN PLATEAU STATE. By Yemi Kosoko
- We will build a bigger, better church,” Pastor Oyakhilome boasts
- The Newly inaugurated Members of the Local Organising Committee
- 2026 FIFA WORLD Cup: Resign if Eagles fail to qualify, Sports Editors’ guild tells NFF board, Finidi
- FG Launches $40M ICT Development Project in 10 Federal Universities
- Northern Insecurity spilling into Kogi State, says Ododo
- Nigeria Police Finally End Pregnancy Dismissal Law for Female Officers
- Leadership That Listens, Leads, and Transforms: The Ady Macauley Standard
- Scrapping Or Renaming? Mixed Reactions Erupt Over Niger Delta Ministry Shake-up
- Historic Visit: Tinubu And Wike: Welcome Indian PM Modi To Strengthen Nigeria-India Ties
- Former Minister Sunday Dare Extols Soun Residents For Voicing Out On Deplorable state Of Oyo-Ogbomoso Road
- FALEKE FIRES UP LAGOS! 40,000 STREET CAPTAINS UNVEILED TO DRIVE PVC COLLECTION AHEAD OF 2027!
- Paulo Homes: A Land Grabber Bites the Mantle of Restriction.
- Police Relaunch Online Tinted Glass Permits—Here’s What You Must Know Before May 31
- Tinubu’s Bold Deadline: Nigeria’s Security Agencies Ordered to Eradicate Kidnappers and Bandits by 2025
- Subsidy Savings: Here’s How the Tinubu Administration is Transforming Nigeria
- Presidential Media Team Meet Minister Of Finance… Seek Enhanced Collaboration To Strengthen National Communications Efforts
- Alaafin vs Ooni: Stop inciting traditional rulers against one another, Elebuibon counsels Yoruba sons, daughters
- Ogbomoso Muslims Shower Encomiums On President Tinubu As Chief Sunday Dare Hosts Muslims to Iftar,Shares Rice on behalf of President Tinubu
- Tinubu approves renewed hope infrastructure development fund.
- Chief Sunday Dare Commiserates with Governor Makinde Over Brother’s Death.
- On the World Bank Loan
- Tinubu Rules Out One-Party State, Reaffirms Support for Multi-Party Democracy
- Controversial Praise: Tinubu Calls Wike a ‘Good Man’ Amid Land Grabbing Allegations
- Tinubu: “I Couldn’t Watch WAFCON Final—It Was a High Blood Pressure Risk!”
- Tinubu’s Eid Message: Why Nigerians Must Stay Steadfast Amid Challenges
- Close Call: Five Escape Death as Cargo Plane Skids Off Abuja Runway
- Tinubu Appoints IBB’s Son, Eight Others to Lead Key Federal Agencies
- No More Extensions for Export Proceeds Repatriation”
- ADDRESS BY PRESIDENT BOLA AHMED TINUBU, GCFR AT THE JOINT SESSION OF THE NATIONAL ASSEMBLY IN COMMEMORATION OF DEMOCRACY DAY, 2025
- Office of the Secretary to the Government of the Federation
- Tinubu’s Reforms Fueling a New Wave of Subnational Development. -Sunday Dare
- NEITI Targets $6 Billion Recovery in Oil Sector: A Deep Dive into Nigeria’s Financial Crackdown
- PRESIDENT TINUBU CONGRATULATES D’TIGRESS ON WINNING FIFTH CONSECUTIVE AFROBASKET TITLE
- 20 Days to Go: Rush Begins, as Ticket Sales Open for Barça Legends vs African Legends Clash in Abuja
- President Tinubu Issues Two-Week Deadline for Abuja Property Rent Defaulters
- Shettima Launches Programme to Repurpose Thousands of Abandoned Public Assets Nationwide
- Tinubu Appoints Adeyemi Olumode as New Controller-General of Federal Fire Service
- Nigeria’s Historic Bid for the 2030 Commonwealth Games: A Call for National and Global Support
- Tinubu Returns from France to Unveil Bold Plans Ahead of 2nd Anniversary
- 7 Days Or Termination: Umahi Puts Julius Berger On Notice Over Abuja-Kaduna Road Delays
- Muhammadu Buhari 1942-2025. Adieu !
- FG Announces N75,000 Cash Transfers for 70 Million Nigerians by 2025: Here’s What You Need to Know
- NSC DG Hon. Bukola Olopade Highlights Media as Core Element in Nigeria’s Sports Industry Transformation
- Obasanjo Storms Lagos Assembly, Declares Himself Speaker
- N’East APC Stakeholders Lobby Shettima, Ribadu for Ministerial Slot, Push Sardauna as Choice
- FG Shuts Down Ibadan Airport for International Makeover
- New Dawn for Ajaokuta: Gov. Ododo Flags Off 12.5km Road to Unlock Economic Potential
- Lawyer Demands Constitutional Amendment for Police IG’s Tenure Extension
- Breaking News ! Gumi backs Tax Reforms
- NSC DG, Hon. Olopade Commends Cricket Federation, As Nigeria Wins ICC Men’s T20 Sub-regional Tourney
- Breaking: Warri Refinery Roars Back to Life—Here’s What You Need to Know
- PDP Zoning Shakes 2027 Race: Saraki, Bala Out – Jonathan, Obi, Makinde Eyed
- Labour Party in Freefall: 21 Lawmakers Abandon Ship as 2027 Looms
- Celebration Turns Tragic: Trigger-Happy Policeman Kills Nursing Mother in Ekiti
- Governors should Relax -Supreme Court Judgment Stands in Favour of the Masses
- Tinubu and Macron: Leveraging friendship for development
- Ex Sports Minister Sunday Dare Applauds Appointment of Finidi, Amokachi into Super Eagles Coaching Setup
- Tinubu Unveils Two New Federal Universities
- 1st African School Games: Nigeria Shines Bright, Steals Spotlight at Colourful Opening Ceremony
- Betrayed By My Own: Ondo LP Candidate Points Fingers At Obi, NLC For Poll Defeat
- Abuja safe, no cause for alarm, FG assures amid U.S. travel warning
- AGF Explains Why Fraud Charges Against Fidelity Bank CEO Were Dropped
- Labour Unions Stand Firm: Governors Can’t Take Over Minimum Wage Negotiations
- Guguwar Buhari” Is Gone: The End of Handout Votes in Arewa Politics
- Civil Service Shakeup: Tinubu Approves Major Redeployment of Permanent Secretaries
- Tinubu Touches Down in Abuja After Attending Historic Inauguration of Pope Leo XIV
- FG Rolls Out N6 Billion Credit Lifeline for NYSC Members
- Buhari Breaks Silence on Abuja Land Saga, Disowns Trust Foundation Linked to Him
- CBN Caught in N30 Trillion Scandal Senate Accuses Apex Bank of Blocking Probe
- BREAKING: Tinubu Touches Down in Los Angeles on Way to Brazil After Japan Conference
- PDP Drama: Umar Damagum Set To Remain Chairman Amid Leadership Crisis
- No One Dares Tinubu And Wins: NSA Ribadu Sends Strong Warning To Terror Group Lakurawa
- Ijeoma, daughter of late Dora Akunyili elected as Harvard Kennedy School alumni board member
- Senator Orji Uzor Kalu Calls For Revisit Of Regional System Of Government
- A Call For Caution: Why Protest May Not Be The Answer For Nigeria
- Gov Okpebholo Rescues Over 10 Accident Victims on Benin–Auchi Highway*
- FG Halts Controversial Doctors’ Allowance Policy to Avert Looming Strike
- Blogger Nabbed for Cloning DSS Website and Running Fake Recruitment Scam
- Tinubu Administration : Engendering A Robust Strategic communication Regime
- 4Days to Go: Congo Becomes First Nation to Arrive Nigeria for 3rd African U18/U20 Athletics Championships
- Ogbomoso: Muslim leaders clarifies right of monarch to appoint Imam
- Tinubu’s Achievements Have Derailed Coalition Plans — Wike
- Why French Man Eric Chelle Is The Best Answer For The Super Eagles Job Ahead Of Tom Saintfiet
- President Tinubu Issues Two-Week Deadline for Abuja Property Rent Defaulters
- NBA (Seun) Must Guard Against Partisan Slippage
- Resilience, Elegance And Support: The Untold Truth Behind Chidimma Adetshina’s Miss Universe Triumph
- Job Scam Alert: Federal Civil Service Commission Denies Ongoing Recruitment
- FIFA Bans Katsina United For Three Registration Window
- No, INEC Chairman Mahmood Yakubu Was Not Sacked — Presidency Breaks Silence on Viral Rumor
- The Game of New Thinking: How Federation Secretaries Are Powering a New Era for Nigerian Sports
- Tinubu Greenlights N20 Billion to Control Nigeria’s Space
- FG Finally Moves to End Abuja-Kano Road Nightmare After Years of Delays
- Court Declines Bid to Halt National Assembly’s Role in Rivers Budget Approval
- FG Shuts Down Independence Bridge for Repairs Starting April 1
- NSC Advances Vision of Nigeria as a Global Sporting Hub, as International Gymnastics Course Holds in Abuja
- VICTOR OSIMHEN FACES INDEFINITE BLACKLIST FROM THE SUPER EAGLES
- Customs Seize ₦905m Rolls-Royce Ghost in Ogun, But Smuggling Scandals Cast Shadow on Border Security
- Tinubu Honours Democracy Heroes: Yar’Adua, Nwosu, Soyinka, Falana, Ogoni Nine Among Awardees
- NYSC Increases Corps Members’ Allowance to N77,000
- DG NSC Bukola Olopade celebrates Kunle Soname as he clocks 59
- NewsBREAKING: Protest breaks out in Makurdi as Agan women block federal highway over insecurity
- NSC Unveils “RHINSE” Initiative to Reset, Refocus, and Relaunch Nigeria’s Sports Sector
- Who Says Tinubu is Not Bothered About Insecurity in the North?
- FG’s New Plan to Tackle Unemployment: Why NGOs Hold the Key to Millions of Jobs
- President Tinubu Mourns Former CAF President Issa Hayatou
- British Drug Smugglers Nabbed as NDLEA Uncovers ₦6.5bn Worth of Narcotics in Lagos and Rivers
- NATIONAL COUNCIL OF STATE UNANIMOUSLY APPROVES APPOINTMENT OF PROFESSOR AMUPITAN AS INEC CHAIRMAN
- Professors Demand ₦2.5m Monthly Pay, Cite Poor Conditions and Brain Drain Risk
- Political Earthquake: Four Labour Party Lawmakers Jump Ship to APC
- You All Should Be Proud of Me!” Pastor Tobi Adegboyega Speaks Out Amid Deportation Drama
- OFFICE OF THE SECRETARY TO THE GOVERNMENT OF THE FEDERATION
- Exclusive: Local Government Autonomy Stalls as FG, CBN, and States Clash Over Direct Payments
- GOV AIYEDATIWA NOMINATES FOUR MORE COMMISSIONERS
- 22nd National Sports Festival Medals Table Summary – Day 3
- SUNDAY DARE HONORED WITH PRESTIGIOUS AWARD BY SPORTS WRITERS ASSOCIATION OF NIGERIA
- Port Harcourt Refinery Set to Produce 12 Million Liters of Petrol Daily, Begins Next Month!
- Alaafin of Oyo Refutes Supremacy Clash with Ooni, Cites History and Colonial Recognition of His Throne
- NSC Swiftly Activates ‘Adopt-an-Athlete’ Training Grant Initiative to Support Ese Brume After Ghastly Car Crash
- Davido Breaks TikTok Records With Peller – Sets Unbelievable New Milestone In Africa
- NSC Confirms Key Dates for 2025 National Youth Games
- Customs Seize Undeclared Cash Worth $2.2m at Nigerian Airports
- And The Award For Profligate Spending Goes To…
- FEDERAL MINISTRY OF FINANCE, ABUJA.
- America’s Eyes on Nigeria: Professor Sadiq Abba Says U.S. Interests Go Beyond Diplomacy—From Tinubu’s 2027 Politics to Global Energy Power Plays
- Today, June 6, is the 80th anniversary of D-Day when allied troops landed on the Normandy beaches with Nigerian groundnuts in their packs.
- FG approved N4.2 billion to universities.
- *National Sports Commission Team Inspects Enugu Facilities Ahead of 2026 National Sports Festival*
- PRESIDENT TINUBU ANNOUNCES MEMBERS OF THE GOVERNING COUNCIL AND BOARD OF TRUSTEES FOR HYREP
- AFCON Controversy: CAF President Blasts Inhumane Treatment Of Nigeria’s Super Eagles In Lybia
- Akpabio Shuts Down Senators Compliment During Bianca Ojukwu’s Screening: ‘Stick To Her CV’ Sparks Laughter In Senate
- NewsMultichoice Nigeria fined over N766m for violating NDP Act
- N89.2 Billion Transformation: Roads and Schools Revamped in FCT Under Tinubu’s Administration
- Ibom Air Clears the Air: ‘We Didn’t Leak Passenger’s Indecent Video
- National Assembly Passes N54.99 Trillion Budget
- The President is a proper Yoruba Boy, Bows for Democracy
- Take Advantage of President Tinubu’s Youth Initiatives – Chief Sunday Dare Charges Nigerian Youths
- Oyo Police Uncover Human Trafficking Syndicate, Rescue 83
- “Cracks Emerge in Planned Nationwide Protest as Key Groups Withdraw Support”
- Ebonyi Massacre Sparks Outrage: Pro-Biafra Group Declares Self-Defense Strategy
- 2025 AfroBasket: Nigeria’s D’Tigers Outclass Madagascar 77–59 in Opening Game
- Planned Protest: CAN Stands In Solidarity With Nigerians.
- NSC DG Olopade Hails Kunle Soname’s Impact on Nigerian Sports
- Tinubu’s 2025 Budget: Ambitious Plans for Restoration, Prosperity, and a New Nigeria
- 25 Days to Go: J.J Okocha, Gucho Ronaldinho Set for Skills Reunion in Abuja, as Legendary Champions Cup Clash Nears
- FRSC Officer Abducted In Enugu: Gunmen Demand N5 Million Ransom
- NITDA Unveils Bold Plan to Launch 1,600 ICT Centres Nationwide
- Edo NDLEA Smashes Drug Rings, Nabs 46, Destroys Nearly 40,000kg of Narcotics
- How Nigeria is Leading Africa’s Digital Trade Revolution
- John Mahama Returns to Power: Sworn In as Ghana’s President in Star-Studded Ceremony
- Much Ado About Trump’s Threat of Military Attack Against Nigeria: Tinubu Should Not Kiss the Ring By Wale Alonge
- MVP Iwobi Shines, Bags Assist As Fulham Defeats Crystal Palace 2-0
- NUT Faults WAEC, NECO Over Shift to Computer-Based Testing, Says It Won’t Stop Exam Malpractice
- Dangote Confirms Rollout Date For Nationwide Fuel Distribution, Move to Unleash N720bn CNG Trucks
- Nigeria to Raise ₦80 Billion Through Bond Auction on July 28
- PRESIDENT TINUBU’S TRIBUTE TO POLITICAL ALLY HONOURABLE ADEBISI YUSUFF ON HIS BIRTHDAY
- African School Games: Team Nigeria to Compete in 7 Finals on Day 2 of Athletics, Clinches Two Bronze in Taekwondo
- Nigeria Joins BRICS Countries to Counter US Trade Threats
- Court Tosses Out NANS’ Legal Challenge Over ASUU Strike Amid Leadership Dispute
- International Women’s Day: Ex-Minister Sunday Dare Applauds President Tinubu For Allowing Nigeria Women To Thrive.
- Sweden-Based Nigerian International Matins Moses Ebuka Brings Hope to Rural Kids Through AddBrand Cup
- NSC Salutes Junior D’Tigress on Winning Start at FIBA U19 Women’s World Cup
- Iwobi Scores Against Former Club Everton, As Maja And Ajayi Feature In West Brom’s Stalemate
- FG Approves Cash Transfer for Over 2 Million Struggling Households
- National Alarm: 61% of Candidates Fail 2025 WASSCE as WAEC Withholds 192,000 Results Over Exam Fraud
- Black Gold in the North: NNPCL Strikes Four Wells in Kolmani, Bauchi — and Eyes More
- Silent Killers: FG and States Unite to Fight Neglected Tropical Diseases”
- LATEST: Nigeria inflation rate skyrockets to 34.19 percent – NBS
- Northeast APC Leaders Back Tinubu-Shettima Ticket for 2027 Presidential Race
- Trump says US launched ‘very successful’ attack on Iran nuclear sites
- Rivers Assembly Chamber Set for Reopening as Sept. 18 Deadline Approaches
- On Rivers State: President Tinubu Delivered Stability. ADC Came Late
- Tokyo 2025: NSC Steps In to Resolve AFN Challenges at World Athletics Championships
- Tinubu Appoints New CEO For Digital Bridge Institute, Directors For NIGCOMSAT
- Nigeria’s Economic Reforms: Government Exits Ways And Means Borrowing, Subsidy Removed
- Libya’s Retaliation: Mass Arrests Of Nigerians After CAF Verdict On Super Eagles Incident
- KWANKWASO ABSOLUTELY FALSE, MISLEADING, AND SELF-SERVING –
- Tinubu Vows to Deliver 284km Kano-Maradi Rail Line by 2026
- Speed Darlington Battles IGP in Court: N300 Million Lawsuit Over Alleged Torture and Unlawful Detention
- NSC Rallies Behind Team Nigeria as Amusan, Brume Lead Squad to 2025 World Athletics Championships in Tokyo
- STATEHOUSE PRESS RELEASE Details of The Presidential Pardon and Clemency
- Tinubu Shakes Up Aviation Training: Six New Campuses Unveiled Across Nigeria
- PRESIDENT TINUBU: WEST AFRICA MUST TURN DEMOGRAPHIC STRENGTH AND MINERAL WEALTH INTO JOBS AND INDUSTRY
- Justice For The Voiceless: Tinubu Orders Immediate Release Of Detained Minors After Global Outrage
- Police Crackdown on Third-Party Insurance Begins—Here’s What You Need to Know!
- Ahmed Musa Scores Late Winner As Pillars Fall On Plateau United
- Buhari Presidency Product of Tinubu Support – Dare
- Phyno Reacts To Scandalous Leaks: Baltasar Ebang Engonga And His 300 Women Exposed
- Massive Shake-up at CBN: Meet the 16 New Directors Leading Nigeria’s Financial Future
- Alleged Breach: FCCPC To Arraign MultiChoice Chairman, Others
- The South West and the Reforms in the Mining Sector
- Federal Government Releases N2.25 Billion to Boost 16,696 Small Businesses in Gombe
- Bangladesh Prime Minister Resigns, Flees Country After Deadly Protests
- Tragic Stampedes Spur IGP’s Warning: Unorganized Palliative Distribution Banned After 65 Deaths
- From Vision to Reality: Tinubu’s Bold Plan to Build a Trillion-Dollar Nigeria
- Kwankwaso Accuses Tinubu of Neglecting the North: “National Budget Now Tilting Southward” KANO
- NNPC Slashes Fuel Price Just Two Days After Sharp Hike, Sparks Mixed Reactions Across Abuja
- Labour Groups Slam New Unemployment Data: ‘A Fabrication That Doesn’t Match Reality’
- NSC DG Bukola Olopade Congratulates NFF President, Gusau On WAFU B Election Victory
- APC National Chairman Umar Ganduje resigns
- RE: BUHARI’S BURIAL — A RESPONSE TO ADC’S OBNOXIOUS STATEMENT
- Weightlifting Contingent Lifts the Nation’s Spirits, as Team Nigeria Closes African Championship with 13 Gold, 4 Silver and 1 Bronze
- PRESIDENT TINUBU ASSURES COLOMBIA OF SWIFT IMPLEMENTATION OF ALL BILATERAL AGREEMENTS
- Reps Approve $347m Loan Boost for Lagos-Calabar Highway, Rural Connectivity
- Trump Tells Putin to Stop Attacks on Kyiv
- Tinubu Names Maj-Gen Oluyede As Acting Army Chief, Vows To Boost Security Nationwide
- BREAKING NEWS: 844 rifles, drugs intercepted by Customs
- Nigeria Races to Avert Catastrophe with Over 1 Million Life-Saving Vaccines
- FG Launches Game-Changing Loan Scheme for Small Businesses in Nigeria
- Ghana Mourns: Full Identities of Military Helicopter Crash Victims Revealed
- To Bala Mohammed “ Northerners are not beggars. Our Governors should stop embarrassing us …”
- President Tinubu Welcomes The Report Of New GDP Growth, Assures Of Stronger Economic Performance
- Former Governor Amosun Admits To Signing Away Ogun Trade Zone To Dubious Chinese Investors
- Nigeria Strikes $1 Billion Sugar Pact With China to Crush Import Dependence
- Davido Shatters Streaming Record With New Song After Wizkid Throws Shade: ‘Clear Road’ He Says
- TERRORISM: DSS GIVES UPDATE ON PROSECUTION OF TERROR SUSPECTS
- Nigeria’s Creative Industry Set to Inject $100 Billion into Economy by 2030 – Minister Musawa
- Game Changer: Nigeria to Boost Oil Output with $315 Million Indigenous FPSO Vessel
- Shocking Revelations: Ex-Minister Spends N20 Million of Mambilla Hydro Funds on One-Year Hotel Stay
- Nigeria’s Economy on the Rise—Presidential Aide Boasts of $16 Billion Trade Surplus
- Dust, Clouds & Thunderstorms: NiMet Issues Urgent 3-Day Weather Warning!”
- First Lady Boosts Nigeria’s TB Fight with 10 Diagnostic Machines, ₦1bn Support for FCTA
- Federal Government Blocks N83bn Protest Funds Arrest Key Sponsors In Abuja,Kano,Kaduna
- Under President Tinubu, Nigerians Begin To get the Right Communication, Says Ex-Minister Sunday Dare
- BREAKING: Eight Nigerian Banks Hit Recapitalisation Milestone Ahead of 2026 Deadline – CBN
- Bombshell: Attorney-General Declares Governors Have No Power to Sack Local Government Chairmen
- Tinubu Rewards Loyalty: Two Senior Aides in VP’s Office Get Major Promotions
- GOVERNOR OYEBANJI OF EKITI STATE DISSOLVES CABINET
- Tinubu Urges Nigerians: Tough Times Now, But Prosperity Is Coming
- President Tinubu Assures Of A Robust Economy
- Drama in the Senate: Wike Ordered to Halt Demolitions Amid Heated Debate and Walkout
- Borno Flood Victims: Toll Increases
- We Deseerve A Seat At The Table: Itsekiri Chief Reminds Tinubu Of Election support, Demands Inclusion In Govt
- FCTA Issues Demolition Order for 10 Duplexes in Wumba Over Abuja Master Plan Violation
- President Tinubu Set to Unveil Major Infrastructure Projects in Anambra on May 8
- APC National Chairman Prof.Nentawe visits Sen. Yari
- No Favors, No Corruption: Umahi Clears Air on Lagos-Calabar Highway Contract
- FESTAC Clean-Up: KAI Pulls Down 150 Illegal Structures, Evicts 80 Squatters as Residents Cheer Move
- Grassroots Support for Tinubu’s 2027 Re-election Gains Momentum in Lagos
- Tinubu Approves N32.7 Billion to Lift Vulnerable Nigerians—Here’s How You Can Benefit
- Japan’s ₦100 Billion: How This Loan Could Transform Nigeria’s Food Production
- Nigeria-UK Trade Partnership: Minister Targets Billions In Growth Opportunities
- Day of Reflection: FG Declares Tuesday Public Holiday to Honour Buhari’s Legacy
- Shocking Binance Scandal: Detained Executive Alleges $150 Million Bribe Demand from Nigerian Lawmakers, SSS Involvement, and NSA’s Billion-Dollar Ambition
- DG NSC Bukola Olopade charges Sports Federations Secretaries on Innovative Approach for optimal output
- Wike Loyalists Dominate PDP & APC Slates in Rivers LGA Elections: Full Candidate Lineup
- ₦71.2 Billion Vanishes from Student Loan Fund — ICPC Exposes Shocking Fraud in Nigerian Universities and Government Circles
- A Call to Hope and Action- A Message to the Youth of Sierra Leone
- How the 47th President Plans to Reshape America and the World
- Call For Peace In Rivers State: Former Minister Sunday Dare Urges End To Political Turmoil
- Renewed Hope Creative Villages’: FG Unveils Bold Plan to Transform Nigeria’s Historic Sites into Art Hubs
- Sports Minister Charges Team Nigeria to Fly High at Olympics, Officially Hands Over Team Nigeria Contingent to the NOC and NPC
- Tinubu Backs Local Arms Production, Vows Stronger Security Frontline
- Federal Workers to Receive N175,000 in 5-Month Wage Arrears — Starting This April
- Supreme Court shortlists 98 Lawyers as new Senior advocates of Nigeria
- New Age Limit For WAEC, NECO Exams – FG
- Senator Natasha Akpoti-Uduaghan Set to Resume Duties July 15 After Court Lifts Suspension
- Ondo State and BINL Set Sights on $15 Billion Mega Refinery to Power Nigeria’s Energy Future
- 11 Days to Go: Invited Junior Athletes Ready to Challenge Status Quo at Gateway Games 2024
- EXCLUSIVE: IGP Egbetokun Ousts AIG Fayoade From Lagos Command To Block His Rise As Next Police Chief
- 2027 Presidency: Mark cautions Atiku, Obi as FG slams coalition chiefs
- Lagos Partners Access Bank to Build Affordable Housing: 704 Homes for Low-Income Earners Coming Soon
- FG Moves to Standardise University Fees Nationwide
- Insecurity: ADC Slams PDP Governors’ Zamfara Meeting, Demands Emergency Rule
- Libyan FA Fights Back: Vows Legal Action After CAF Hands Nigeria Victory In Airport Saga
- Olawepo-Hashim Slams PDP Zoning Decision, Says Move Bolsters Tinubu’s 2027 Chances
- Reclaiming NNPC: A Necessary Reset to Rescue Nigeria’s Oil Industry from Systemic Rot
- Why Nigeria will Keep Importing Petrol: Unveiling The Hidden Truth Behind The Country’s Fuel Crisis
- Senate Approves Bill for New National Eye Centre in Kogi
- BREAKING: Atiku Abubakar Stripped of Waziri Adamawa Title in Major Political Earthquake
- WAEC Unveils Game-Changer: Resit Exams for WASSCE Students—Everything You Need to Know
- UMTH Performs Second Kidney Transplant, 15 Years After First Landmark Surgery
- Tension in Kaduna as Police Drag El-Rufai, ADC Leaders Into Probe Over “Conspiracy, Incitement
- ASUU Warns FG of Impending Action Over Stalled 2009 Agreement
- Nilayo Sports roll out dates for Access Bank Lagos City Marathon 10th Anniversary Expo
- Dangote Refinery Set Sails: A Game-Changer For African Fuel Markets
- Crashed Helicopter Tragedy: NAMA Turns To Neighboring Countries For Help As Families Mourn Victims
- 21-year-old Nigerian midfielder, Christantus Ugonna Uche, has joined Spanish top club Getafe FC from AD CEUTA FC in the Primera División RFEF – a thirddivision club in Spain football.
- Ranchers Bees FC Bolsters Infrastructure with New Bus Acquisition Ahead of NNL Season*
- Chinese Bank Boosts Kano-Kaduna Railway with $254M Lifeline
- WAEC Denies Cancelling 2025 WASSCE, Labels Viral Report “Fake News”
- No Room for Political Influence: FG Defends Integrity of Cash Transfer Social Register”
- N197 Billion Vanishes: Auditor-General’s Report Exposes Shocking Contract Fraud In MDA’s
- Unraveling The Fuel Scarcity And Price Hike Conundrum In Nigeria
- Did Sanwo-Olu Sue EFCC? Lagos Governor Finally Breaks Silence Amid Rumors
- Outrage Over Military’s Delay In Paying Benefits To Deceased Personnel’s Families – Senate Demands Action
- ERC Urges Tinubu to Meet ASUP Demands, Avert Looming Polytechnic Strike
- Babangida Breaks Silence: The Shocking Truth Behind Buhari’s Overthrow
- Nigeria Relaunches National Talent Export Programme to Tap $1 Trillion Global Outsourcing Market
- NITDA Teams Up with UK’s Lancaster University to Accelerate Nigeria’s Digital Revolution
- INEC’s N126 Billion Demand: Why N40 Billion Won’t Cut It for Nigeria’s 2025 Elections
- President Bola Tinubu Meets With King Charles III At Buckingham Palace
- Beware the Trap: Retired General Ijioma Warns Peter Obi Against PDP Return
- National Sports Commission Leadership Meets President Bola Ahmed Tinubu in Aso Villa
- Economy Responding to Tinubu’s Policies – Dare
- Pakistan Salutes Nigeria’s Military Might — Calls It a Model for Counter-Terrorism in Africa
- The Divided Baby And The Divided Nation:A Reflection On Nigeria’s Turmoil
- Education Minister Retracts Statement, Affirms Validity of 2009 FG-ASUU Agreement
- Tinubu: A Chronicle of Sacrifice for Northern Nigeria
- FG Orders WAEC, NECO to Go 100% Digital by 2026
- Our Partnership Is Rooted In Mutual Respect And Shared Values
- UPDATED: Court lifts Akpoti-Uduaghan’s Senate suspension but fines her N5m for contempt
- MTN Temporarily Closes Nationwide Offices Due To Vandalism
- PRESIDENT TINUBU HAILS WINNERS OF BY-ELECTIONS IN 12 STATES, COMMENDS INEC
- 3 Days to Go: South Sudan, Seychelles, Congo, Egypt, Botswana, South Africa Arrive Abeokuta for Showdown at 3rd CAA U18/U20 Championships
- Tinubu Open to Concessions as Tax Reform Sparks Nationwide Debate”
- Terrorist Invasion: Mali And Burkina Faso Militants Now Threaten Northwest Nigeria, Senate Warns
- NSC Receives Commonwealth Sports Bid Evaluation Committee in Abuja as Nigeria’s 2030 Bid Advances
- France: A Strategic Push for Economic Growth and Regional Stability And The Agenda Before President Tinubu
- Inside the EFCC Scandal: How Corruption and Stolen Assets Are Rocking Nigeria’s Anti-Graft Agency
- Nigerian-Born Chido Obi Martin Completes Medical Tests Ahead of Manchester United Move
- National Honour Sparks Controversy: PDP Slams Tinubu For Conferring GCON Indian PM Modi
- Nigeria’s 2025 Budget Faces Massive Challenges, Stakeholders Warn Of Underperformance
- Tinubu Lauds Tunde Onakoya’s Chess Feat, Pledges Government Support During Lagos Meeting
- New Super Eagle Coach Eric Chelle Bids Emotional Farewell to MC Oran With Win, Jets off to Nigeria
- Nigeria Deports Over 100 Foreign Nationals Convicted in Crypto Romance Scam Crackdown
- Edo Governorship Election: A Tight Race Unfolds
- Dangote Cement Teams Up with Tetracore Energy to Revolutionize Logistics with CNG Supply
- NDLEA Sells Off Drug Lords’ Mansions and Luxury Cars in Landmark Auction
- AFCON Shocker: Benin’s Rohr Hit By Major Setback Ahead Of Clash With Nigeria
- 5th Year Remembrance:Sen Abiola Ajimobi, an Exceptional Political leader. He will Continue To Be Remembered For His Patriotism,Says Chief Sunday Dare.
- FG to Begin Overhaul of Failing Electricity Distribution Companies
- Akpabio vs. Natasha: Power Struggle in the Senate Takes Legal Twist
- 44 Year Old Rabiu Ali’s Penalty Secures Away Victory For Kano Pillars Over Bendel Insurance
- NSC DG Bukola Olopade arrives in Malaysia to boost support for Nigeria U19 Cricket team at the ICC T20 Cricket World Cup
- Shock Move: Burkina Faso’s Military Leader Sacks Prime Minister, Dissolves Government
- NSC DG, Hon. Bukola Olopade Charges D’Tigers to Roar Ahead of Afrobasket Qualifiers in Libya
- Tinubu Prioritize Safety Net For Nigeria’s Most Vulnerable, Promises Support Reforms Amid Economic Challenges
- Lagos LG Elections : Low turnout threaten 2027
- 30 Days to Go: Countdown to the PremiumTrust Bank Abuja City International Half Marathon!
- Breaking News: Minister of Finance, Wale Edun Presents N105,000 As Minimum Wage To Tinubu
- PDP Bigwig Unfazed By Mass Defection To APC: “We’re Unbothered”
- Naira Surges Ahead of Public Holiday, Gains Strongly Against Dollar Abuja, Nigeria
- President Tinubu And Vice President Shettima pays Respects At Late COAS Lagbaja’s Funeral
- Martial Arts Pastor Fights Off Axe-Wielding Intruder in Epic Thanksgiving Showdown”
- “Defying the ‘Japa Syndrome’: Meet Dr. Adedoyin Adeleke, the PhD Holder Who Returned to Nigeria to Drive Green Growth”
- President Tinubu Throws Lifeline To Dangote Refinery With Landmark Proposal.
- Ex-Delta Governor Ifeanyi Okowa Arrested For Alleged N1.3 Trillion Derivation Fund Fraud
- Ondo Decides: Tinubu Urges Peaceful Poll as Voters Hit the Ballot Amid Tension
- Executive order: Tinubu to stop payment of taxes, levies in dollar
- PRESIDENT TINUBU RECALLS DG OF NTA, ED NEWS; SETS ASIDE FRESH APPOINTMENTS
- Nigeria to Vaccinate 1.4 Million Animals in 2025 Under Major Livestock Health Boos
- How Nigeria and the EU Are Redefining Trade and Investment
- From Kudi Abiola Corner to Dobale for Democracy
- NSC Recognises AFFAN for Inclusion in National Sports Federations’ Boards*
- STATEHOUSE PRESS RELEASE
- Nigeria Slams 10-Year Ban on Expatriates in Sweeping Immigration Crackdown
- PRESIDENT TINUBU CONGRATULATES ZAMFARA STATE GOVERNOR DAUDA LAWAL ON HIS 60TH BIRTHDAY
- This Is Not 2013: Why the ADC Coalition Can’t Mirror the APC – Dare
- Nigeria Hosts Historic “Chaos in the Ring” Boxing Fight, as ex Commonwealth Champ Azeez, Glanton Dominate
- Tinubu Must Shake Up Cabinet or Risk 2027 — Nataro Warns
- Times Are Tough, But Brighter Days Ahead, Tinubu And Sanwo-Olu Tell Nigerians
- President Tinubu Approves Takes Off Consumer Credit Scheme
- Lagos Shuts Down Major Ikeja Road for APC Primaries — See Affected
- Legendary Artist and Actress Onyeka Onwenu Passes Away In Lagos
- Trump’s ignorance about Nigeria: The dangers of a manufactured “Christian genocide”, By Phillip van Niekerk
- 3 Days to Go: From Festival Fanfare to Global Glory – 3 Athletes Who Rose from the National Sports Festival to International Stardom (Part 2)
- Governors Back Tinubu’s Tax Reform, Propose Bold New VAT-Sharing Formula
- Tragedy in Jigawa: Death Toll Rises to Nine in Farmers-Herders Clash
- Meet Éric Chelle: The Mastermind Tasked with Steering Nigeria’s Super Eagles to Glory
- Nigeria’s industrialization jewel Under Attack: Akinwunmi Adesina Weighs In On Dangote Refineries Debate
- 2027 Power Play: Pro-Wike PDP Faction Pushes For Makinde As Presidential Candidate
- Nigeria’s Power Grid Crisis: Why More Blackouts Are On The Horizon Despite Government Overhaul Plans
- President Tinubu Assures Of More Stability In The Oil Sector With Naira For Crude Transactions, Urges Stakeholders To Uphold The Interest Of The Nation
- SOKAN Responds to El-Rufai’s Misrepresentation of Southern Kaduna
- Tinubu’s Paris Retreat Sparks Speculation Over Cabinet Reshuffle
- Tinubu’s Health Revolution: Shettima Unveils Plan to Build 8,800 Health Centres, Go Digital and Leave No Nigerian Behind
- Sunday Dare Responds: ‘I Never Stabbed President Tinubu In The Back’
- From Fame to Frustration: Why So Many Nigerian Ex-Internationals End Up Broke
- Why Nigerian Telecoms Are Pushing for a 100% Tariff Hike – MTN Boss Explains
- Wike denies allocating 2,000 hectares to son in Abuja
- Allow Nigerians Benefit From Tax Reforms, Presidency Tells Ndume
- Governor Dapo Abiodun has made Ogun state an attractive Hub for thriving Sports Economy – NSC DG Bukola Olopade
- President Tinubu Has Laid Down The Facts : Former Minister Sunday Dare Reacts To President Tinubu’s Broadcast To Nigerians
- Nigeria Economy Surges! GDP Grows 3.46% in Q3 2024, Outperforming Expectations
- MissionX Completed: NSC Congratulates Super Falcons on Historic 10th WAFCON Title
- Transportation is the Engine of Nigeria’s Economy, Says Minister Alkali
- BREAKING: APC’s new National Chairman Prof Yilwatda
- 2025: The Year Nigerian Youth Must Take Charge of Their Nation’s Future
- President Appoints New DG For DSS
- Olabisi Onabanjo University’s ‘ no bra, no exam’s rule sparks Nigeria outrage.
- $2.5 trillion Ondo State Marine and Blue Economy investment potentials – Lulu O. Fawehinmi
- FG to Train 2 Million Nigerians for High-Paying IT Jobs—Here’s How You Can Apply
- PremiumTrust Bank Abuja City International Half Marathon Earns World Athletics Label
- NNPCL Hikes Petrol Price to ₦955/Litre Amid Soaring Crude Costs and Depot Rates
- BusinessDangote Refinery reduces fuel price as petrol marketers hold emergency meeting
- Internet Fraud Kingpin Tunde Ayeni Sentenced to 10 Years in U.S. Prison, Ordered to Pay $20M in Restitution
- May Day! Strike Looms as App-Based Transport Workers Protest Exploitation
- Tinubu Vows Prosperity Through Technology, Food Security Despite Hardship
- Game-Changer in Cement Industry: Chinese Giant to Shake Up Nigeria’s Market with $1.6 Billion Lafarge Deal
- Nigeria Reigns Across Africa and Beyond in an Unforgettable Weekend of Glory
- Fresh Challenges For Local Government Autonomy As Soludo Heads For Court
- 800 Special Forces Undergo Intense Training to Crush Insecurity
- Naira Surges Against Dollar: CBN Intervention Sparks Hope For Currency Rebound
- MINISTRY OF SOLID MINERALS DEVELOPMENT (MSMD).
- Speed Darlington Takes Aim At Burna Boy With Baby Oil Music Video : Behind the scenes Drama Revealed
- Global trade tension over fresh US 10% tariff hike on Nigeria, BRICS nations
- Governor Sanwo-Olu Hails Access Bank Lagos City Marathon, Praises Organizers as a Symbol of Excellence
- Petrol Prices Soar to N1,150: The True Cost of Dangote’s Price Hike
- Nigeria Clears $3.4 Billion COVID-19 Loan in Full, IMF Confirms
- Nigerian polician Busted By FBI In $3.3 Million Romance Scam
- Air India Flight to London Crashes Shortly After Takeoff from Ahmedabad
- Stethoscopes Down Until Justice Rings!” – Nigerian Nurses Lay Down Terms to End Strike
- Tinubu’s Renewed Hope and the Silent Western War Against Nigeria
- Pep Guardiola’s Big Regret: ‘I Should Never Have Sold You
- Aregbesola: Hypocrisy Of A Pretentious Revolutionary
- World Bank Pumps Over $1 Billion into Nigeria
- Defamation Drama: Police Slam Activist Lawyer Dele Farotimi with Fresh Cybercrime Charges Over Afe Babalola Allegations
- FEC Approves $651.7M Mega Highway to Connect Lekki Seaport with Southern and Northern Nigeria
- FG declares state of emergency on Suleja-Minna road construction
- Threats of Kidnapping Will Persist Until Nigerians Rise to Defend Themselves – Gen. TY Danjuma
- Nigeria May Hit $1 Trillion Economy With Stronger Banks by 2030
- Nigeria Has Moved On
- Eagle Fail to Fly over Bafana Bafana of South Africa in World Cup Qualifiers in Uyo, Play 1-1 Draw.
- FG Shuts 22 Illegal Colleges of Education in Nationwide Crackdown
- European, Iranian diplomats to meet as US mulls joining Israel Campaign.
- 10,000 Hectares Secured! Firm to Build Affordable Luxury Homes for Civil Servants in Abuja
- Christmas Travel Made Easy! FG Launches 50% Discount on Transport for 144 Routes Across Nigeria
- I Don’t Own the $52.8 Million Repatriated Loot
- EXCLUSIVE: Group Upbeat About Significant Drop in Petrol Prices
- Tinubu Deploys Military to Seize Rivers Government House After Governor’s Suspension
- Lagos Governor Sanwo-Olu Mourns Death Of Chief Emmanuel Iwuanyanwu
- NSC Presents Official Hosting Rights Award Letter to Enugu State for 2026 National Sports Festival
- Deadly Surge: FG Sounds Alarm as Lassa Fever Cases and Deaths Spike Across Six States
- PRESIDENT TINUBU MOURNS THE PASSING OF EMIR OF GUSAU
- NSC DG, Hon. Bukola Olopade Applauds Ogun Women Run, Advocates for More Support for Women in Sports
- 2027 Storm Clouds: Keyamo Warns PDP, El-Rufai Predicts Tinubu’s Fall, NSA Counters “Banditry Lies”
- Tinubu Makes Second Appeal. – “Believe in our ability to deliver”
- NIMC DENOUNCES ALLEGATIONS OF DATA COMPROMISE
- Nigerians to Pay More for Calls & Data—Here’s Why FG and NCC Approved Tariff Hike”
- EFCC Slams Rampant Corruption In Nigeria’s Power Sector, Urges Tougher Asset Recovery Measures
- Pay Up or Lose It: Wike’s Final Warning to Abuja Landowners
- Tinubu Fires PTAD Boss After Just 13 Months-What’s Behind the Shake-up
- Victor Osimhen Tops List Of 6 Highest-Ranked Nigerians In Ballon D’or Histo6, Ahead Of Ademola Lookman
- Tax Reform Tug-of-War: Senate Halts Debate Amid National Outcry”
- Horror At The Courthouse : Atiku Slams Government Over Malnourished Child Protesters
- Dangote Refinery Acquires 4,000 CNG Tankers to Kickstart Fuel Distribution
- Super Eagles Head Coach Éric Chelle Visits Key Super Eagles Players Ahead of FIFA World Cup Qualifiers
- Chagoury, the Lebanese who found Home in Nigeria
- Obi Slams FG’s N142bn Bus Terminals Project, Says Health Sector Deserves Urgent Funding
- The Tinubu Government is leading Nigeria to economic stability. No Panic. – Special Adviser, Sunday Dare Provides useful insights
- CDS HAILS “PRODUCE FOR LAGOS” PROGRAMME, DESCRIBES INITIATIVE AS A MODEL FOR NATIONAL SECURITY AND RESILIENCE
- GEOFFREY NNAJI RESIGNS AS MINISTER , HIS SUCCESSOR TO BE NOMINATED BY GOV MBAH AFTER JOINING APC ON THURSDAY
- Why Captain Ibrahim Traoré’s Moscow Visit Is Sending Shockwaves Globally
- Security: Matawalle leads Nigeria into Defence partnership with India
- No U.S. Military Base in Nigeria: Ribadu Debunks Niger Junta’s Allegations
- NIGERIA’S INTERNALLY GENERATED REVENUE CLIMBS BY 411 PERCENT : MAY 2023 : N711 BILLION. SEPTEMBER N3.635 TRILLION.
- Corruption Wars: Presidency slams Obasanjo, Opposition Sides With Ex-president
- No Stage, no scripts: Tinubu’s cabinet faced the North, answered every question
- President Tinubu Congratulates President-Elect Trump
- NOW TROUBLE IS AWAKE IN THE NEIGBOURHOOD By Dare BABARINSA
- President Tinubu is human- Obi reacts to Tinubu’s Miss-step
- NPFL MD 10: Drama, Upsets, And Thrills As Remo Stars Rise To The Top
- AGF Weighs Dropping Treason Charges Against Starving Minors As Public Outcry Grows
- Dangote Refinery Cuts Petrol Price Again – Now N820/Litre As More Marketers Join Nationwide Rollout
- IPOB Denounces Simon Ekpa, Declares True Biafra Will Come Through UN Referendum
- FG Vows Justice for Slain Worshippers in Katsina Mosque Attack
- Portugal Eyes Nigeria and US Gas to Break Free from Russian Dependence
- Ten West Africa Countries set to storm Abuja for 13th ECOWAS African Wrestling Tournament as Nigeria seeks to host and win to commemorate ECOWAS at 50
- Nigeria’s Open for Business: Shettima Urges Global Investors at 2025 WEF
- NSA Ribadu Fires Back at El-Rufai: Banditry Claims “False, Insulting, and Dangerous”
- VP Shettima Mourns Borno Attack Victims, Assures Enhanced Military Operations Against Terrorists
- Game-Changer for Nigeria’s Insurance Industry: Senate Approves New Capital Requirements to Boost Growth”
- Governor Radda Engages Guardians Worldwide on Carbon Credit Initiative for Katsina
- AFCON Quarterfinalist Éric Chelle Expresses Dream to Coach Super Eagles of Nigeria
- Brazilian President Invites Tinubu for High-Level Talks
- Tinubu’s People-Centric Tax Reforms And Ndume’s Threat
- Tinubu Pledges to Reclaim Forests, Boost Surveillance in North-West During Katsina Visit
- CANADIAN COURT DID NOT DECLARE APC A TERRORIST ORGANIZATION
- President Tinubu Commends Military On Successful Operations In North-West, Pledges Sustained Support
- No Threat to Obi – Just Protocol”: Edo Governor Sets the Record Straight
- Protest Rocks National Assembly Over Adulterated Fuel Scandal: Civil Society Demands Transparency
- 2025 UTME Results Set New Benchmark — JAMB Says It’s Best in 13 Years
- Dangote Refinery at One: How a Single Megaproject is Rewriting Nigeria’s Future
- Customs Uncover Stolen Canadian SUVs, Codeine, and Contraband Worth N3.2 Billion at Apapa Port
- Presidency: Borrowing a legitimate tool for growth, not recklessness
- PRESIDENT TINUBU CONGRATULATES FORMER KATSINA STATE GOVERNOR IBRAHIM SHEMA ON HIS 68TH BIRTHDAY
- ValueJet attempted murder of its passenger for unruly behaviour
- Hajj 2025: Wamakko Urged to Step In for Affordable Hajj Fares and Better Pilgrim Support
- 10 major points From Super Eagles vs South Africa
- 2027 Elections: “No Political Gang-Up Can Stop Tinubu” – APC Chieftain Declares
- Abuja Residents Cry Out As Skyrocketing Food Prices Hit Hard: ‘We Can Barely Feed Ourselves
- Hollywood Mourns: Legendary Actress Dalyce Curry Dies in Los Angeles Wildfires
- TINUBU’S 15% IMPORT DUTY ON PETROL AND DIESEL: A STRATEGIC MOVE TO BOOST LOCAL REFINING
- 109 Foreign Hackers Caught in Billion-Naira Cybercrime Saga: Shocking Details Unveiled!
- Nigerian Military Eyes Partnership with Local Arms Makers to Combat Insecurity
- FIRS open offices during weekends for easy access and flexibility
- Trump’s Crackdown Hits 5,144 Nigerians as FG Prepares for Mass Return
- Afrobasket 2025: Nigeria booked Semi final place with a statement win over Cameroon to set up showdown with Senegal
- How Tinubu’s Bold Move Unlocked Billions for Abuja’s Development
- From Governor’s Mansion to Kuje: Yahaya Bello Remains in Prison Despite N500M Bail Offer
- From Devaluation to Domination: How Tinubu’s Exchange Rate Reforms Turned the Naira into Nigeria’s Export Engine
- Announcement Of The Passing Of Chief Of Army Staff, Lt. General Taoreed Abiodun Lagbaja
- Sunday Dare: A New Chapter As Special Adviser To President Tinubu
- CBN Shakes Things Up: Daily PoS Withdrawals Now Capped at ₦100k—Here’s What It Means for You
- Tinubu Signs Executive Order Introducing Performance-Based Tax Incentives for Oil and Gas Sector
- Fuel Price Hike: Nigerian Lawmakers Warn Of Unrest Amid Deadlocked Government-Labour Meeting
- Shareholders Hail Tinubu’s Reforms as Key to Macroeconomic Stability
- NATIONAL SPORTS COMMISSION REVISED GUIDELINES FOR ELECTIONS INTO THE BOARDS OF NATIONAL SPORTS FEDERATIONS
- Nigeria U23 Striker Promise David Hits Brace in 2-0 Victory Against Kalev
- CBN Governor Declares War on Currency Abuse
- Tinubu is a Brave leader – Emir Sanusi
- Breaking: Tinubu Appoints Brigadier General Kunle Nafiu as New NYSC Boss
- X-raying President Tinubu’s Drive For Foreign Direct Investments
- Turbulence and Triumph: Joe Ajaero Reflects on NLC’s Fight for Survival in 2024
- Philanthropy Meets Politics: Ododo Taps Excel Onuche to Champion Grassroots Revival in Kogi Lokoja
- Nigerian Troops CRUSH Boko Haram Attack on Military Base in Adamawa
- PRESIDENT TINUBU DIRECTS MANDATORY HEALTH INSURANCE IMPLEMENTATION ACROSS MDAs
- Disregard Falsehoods Being Peddled by Tigran Gambaryan against Nigerian Government Officials – FG
- Nobody can create jobs with an interest rate of 30%,Dangote Tells CBN.
- Tinubu Taps Technocrat to Breathe Life Into Ajaokuta Steel
- 239 First-Class Lecturers Exit UNILAG: A Symptom of Systemic Decay
- Tax Reform Showdown: NLC Calls National Dialogue to Halt Controversial Bills
- Federal Government Approves Medipool to Distribute Lifesaving Healthcare Products Across Nigeria
- Shocking! NBET to Spend a Whopping N858 Billion in 2025 – Here’s What You Need to Know
- Benue Speaker Forced Out After Assembly Uncovers N117 Billion Scandal Linked to Governor Alia
- INEC INVITES MEDIA ACCREDITATION FOR 2025 BYE-ELECTIONS
- Drama in Kano: Court of Appeal Restores Sanusi Lamido Sanusi as Emir, Strikes Down Controversial High Court Ruling
- Enugu Governor Mbah Reiterates Call for Nnamdi Kanu’s Release
- Tinubu Turns 73: Seeks Divine Intervention for Nigeria’s Future
- 2027 Power Play: PDP in Talks to Bring Peter Obi Back, Eyes Youth-Led Revival — Rufai
- Family Feud Over $435 Million: Indimi Sisters Take Billionaire Father To Court
- N30 Billion for Youth Dreams: NDDC’s Bold Move to Transform the Niger Delta
- Air Peace Suspends Flight Operations Nationwide Amid NiMet Strike
- House of Reps Probes Missing N200 Billion CBN Loan Meant for Free Electricity Meters
- Reps Launch Deep Probe Into $18bn Refinery Repairs, Vow to Break Monopoly in Oil Sector
- Drama Unfolds: Activist Deji Adeyanju Forced to Backtrack, Begs PDP Chairman and Secretary After Scandalous Claims
- IMF urges Nigeria to tackle FX volatility, inflation
- NSC Marks One Year of Transformative Impact in Nigerian Sports Under Shehu Dikko’s Leadership
- El-Rufai Warns ADC Vanguard: Stop Fabricating Quotes in My Name
- NSC Congratulates Abduljabar Adama, Nigeria Aquatics Federation on Historic Silver Medal at World Junior Swimming Championships
- Tinubu Unveils N45,000 Monthly Stipend to Attract Students to Technical Colleges
- Nigeria Rakes in $8 Billion in Oil & Gas Deals in Just One Year – Verheijen
- Iran votes to close Strait of Hormuz after US strikes on nuclear facilities
- Seyi Johnson Thrilled by New Discoveries at BetKing National Wheelchair Basketball Championship
- Under Tinubu’s Watch – Nigeria Transitions from Reforms to Recovery
- Obasanjo Blasts NNPCL: ‘Disrespectful Invitation Over Refineries Is an Insult to My Office
- Dino Malaye’s Debt Drama: Noise, Not Knowledge
- “Relocate To Sokoto”- Tinubu Tells Service Chiefs, Defense Ministers.
- FG Drops The Hammer: Julius Berger Ordered To Leave Abuja-Kano Road Project Amid Termination Dispute
- 3,000 Jobs and Counting: How Abuja’s New Bus Terminals Are Transforming Lives”
- NRC Adds Extra Lagos-Ibadan, Warri-Itakpe Train Trips Ahead of Eid-al-Kabir
- From Finland To Justice: How Simon Ekpa’s Arrest Could Shake IPOB’S Agitations
- NCDC Addresses HMPV Concerns: What Nigerians Need to Know
- NSC Announces Election Petitions and Election Appeals Committees to Uphold Integrity in Sports Federation Elections*
- 753-Unit Estate Seized from Ex-CBN Boss Emefiele Not Yet for Sale
- Kwara State Government Begins Free Summer Digital Coding Classes For Public School Students
- Oyo APC Blasts Gov. Makinde Over N10,000 Fraud With Swedish Firm, Claims Students Are Being Exploited
- PenCom Meets NLC, Assures Safety of Pension Funds Amid Labour Concerns
- Tinubu’s Adviser and PCNGI Celebrate FIRS Boss on His Birthday
- TAX Reform: Stop deceiving the Poor, Jibril calls out Zullum
- PRESIDENT TINUBU IS COMMITTED TO INCLUSIVE GROWTH
- June 12: Lamido is under political hallucinations. His June 12 account is hogwash – Dare
- Bobrisky’s Damning Audio Reveals Shocking Truth: VDM Sued For One Billion
- Farouk Lawan Walks Free:Former House Of Reps Member Released After Serving Jail Term
- NANNM to Begin 7-Day Warning Strike Over Unmet Demands
- PRESIDENT TINUBU TO LABOUR LEADERS: I AM CONCERNED ABOUT NIGERIAN WORKERS
- Ady Macualey’s Movement Southeast Comrade Ing. Prince Sinnoh Allieu Visits APC Pujehun Office — Promises Support for Rehabilitation
- Nigerians Set for Showdown as NLC Mobilizes Nationwide Protests Against 50% Telecom Tariff Hike
- UN Tourism Chief Calls on African Stakeholders to Harness Tourism for Peace and Unity
- MINISTRY OF DEFENCE
- No Verification, No Salary: FG Sets February 17 Deadline for Civil Servants
- Fake News Alert: Rivers Gov Fubara Denies Shutting Down Oil Operations
- Tinubu Pushes for Fresh Faces: Senate to Decide on PSC and CCB Appointments
- Why Bobrisky Tried To Flee: Immigration Service Breaks Silence On Arrest
- The Making of an Infinite Vote of Confidence.
- Kano Shuts Down Tomato Market Amid Allegations of Prostitution and Immorality
- Presidency Dismisses ‘Hunger Crisis’ Reports as Misleading Projections
- Tinubu Signs Nigerian Insurance Industry Reform Bill Into Law
- WHAT DO THESE NUMBERS TELL US – Sunday Dare
- NBA-SPIDEL Urges FG, RMAFC to Suspend Salary Review for Political Office Holders
- Tinubu withdraws appointment of government official after few hours
- Shettima And Sanwo-Olu Set To Unlock Nigeria’s Economic Revival: The Credit Revolution Begins
- SENATOR RABIU MUSA KWANKWASO. YOU ARE WRONG. NORTH NOT NEGLECTED
- No More Silence”: Niger Delta Fishermen Urge Tinubu to Enforce $3.6 Billion Compensation from Shell Over Bonga Oil Spill
- Senate Commends CGC Adeniyi for Elevating Nigeria’s Global Standing Through WCO
- Good Customs Revolution: Border Patrol Team Dissolved, Checkpoints Cut in Nationwide Overhaul
- Demolition Looms: Lagos Govt to Tear Down Illegal Buildings on Banana Island!
- Kaduna State Police Command Debunks Rumors Of Hijacked Armored Personnel Carrier (APC)
- Pope Leo XIV Makes History as First Augustinian Pontiff — Here’s What That Means for the Catholic Church
- Protest Demands VS What Government Is Doing: A Tale Of Two Agendas
- FG Promises to Deliver Long-Awaited Sokoto-Zaria Road Project”
- Air Peace has suspended all flight operations nationwide
- WHEN SHOWMANSHIP BECOMES DIPLOMACY
- FG Rolls Out N4 Billion Cash Transfer Program for 10 Million Vulnerable Families
- Wike Assures Nigerians Tinubu’s Policies Will Transform the Nation
- FG Unveils Bold Plan to Cut Fuel Costs and Boost Clean Energy
- PDP Governors Caution Against Rising Dictatorship, Hunger in Eid-el-Maulud Message
- PDP In Turmoil: Wike Allies And NEC On Collision Course Over Acting Chairman Damagum
- PalmPay Teams Up with Dyna.Ai to Usher in a New Era of AI-Driven Finance in Nigeria
- Nigeria Teams Up with Swiss Experts to Launch Pharma Academy and Break Free from Drug Imports.
- New State In South West? NASS Pushes To Split Oyo, Stakeholders Sound Alarm On Feasibility
- TINUBU HAS BEEN FAIR TO ALL SECTIONS OF NIGERIA – FG
- Nigeria Premier League Week 11: Heartland’s Winning Streak Continues As Four Clubs Claim Away Wins In A Thrilling Weekend
- Former President Buhari Is And Will Support President Tinubu For 8years_ Sunday Dare
- The North Is Not Marginalized—It Is Mobilized: A Clarification on President Tinubu’s Northern Investments
- Senate Moves to Clamp Down on Social Media Platforms—Here’s What You Need to Know
- Federal Government Deploys Special Forces to Curb Benue Terror Attacks
- A New Era Of Cooperation: President Tinubu’s Historic Visit To China
- Senator Marafa Vows to Slash Tinubu’s 2027 Votes by One Million
- FG Mourns Niger Boat Mishap Victims, Orders Nationwide Water Safety Campaign
- Power Crisis:FG Summons TCN, NERC To Emergency Meeting As Grid Collapse Sparks Blackouts Across North
- The Economy of Ogun state cannot be quantify in Naira and Kobo- NSC DG Bukola Olopade
- Dangote Refinery Slashes Petrol to N890 – What This Means for Nigerians
- N300 Million Lifeline: How FCTA’s Scholarship Scheme is Changing the Fate of 16,225 Indigent Students
- When Power Mongers Regroup: Inside the ADC Circus
- Kaduna Governor Behind Saturday’s Attack – El-Rufai Vows to Present Evidence
- Resolving The Dangote Refinery Debacle: A Call For Transparency, Fair Play And Home-Driven Competition.
- P-CNGI to Build Massive CNG Manufacturing Park in Kogi—Here’s What It Means for Nigeria
- NSC Applauds Nigerian Wrestlers for Golden Start at 2025 Senior African Championships in Morocco
- Battle of Narratives: PANDEF Rejects IPOB’s Push to Include Niger Delta in Biafra Agenda
- ASUU Elects Professor Chris Piwuna as New National President in Leadership Shake-Up
- JAMB, Vice Chancellors Set to Review Controversial UTME Results Amid Mass Failure Outcry
- TINUBU: “I AM CONCERNED ABOUT THE SLOW PACE OF ECOWAS STANDBY FORCE”
- Nigerian Drone Startup Terrahaptix Surges with $2M Revenue, Breaks into South African Mining Market
- President Tinubu Confers GCON On House Speaker Tajudeen Abbas
- Senate to Natasha: “Stay Away Until Suspension Ends” — No Court Order Mandates Recall
- DSS Detains Edo Activist Kola Edokpayi and Five Others Over Planned Rally for Burkina Faso’s Leader, Ibrahim Traoré
- President Bola Tinubu’s State Visit to Brazil: Strengthening a Strategic Partnership
- NSC disqualifies registered Athletes with Antidoping issues from participating in 22nd National Sports Festival
- Game-Changer: Federal Government Partners with Firm to Revolutionize Nigeria’s Livestock Sector
- Tinubu’s Bold Move: Why He’s Keeping Nigeria’s Immigration Boss in Power
- Silence in the Wards: Nationwide Nurses Strike Paralyzes Hospitals Across Nigeria
- 2027: El-Rufai Rules Out Political Ambition, Says His Fight Is for Better Leadership
- N100 Billion Showdown: Senator Natasha Takes on Akpabio in Explosive Court Battle
- Dangote Refineries Poised To Disrupt European Gasoline Trade, Accelerate Refinery Closures
- UK To Nominate Renowned Yoruba Professor To International Court Of Justice
- Nigeria Seeks Global Mining Alliances to Unlock Economic Potential
- High Society Scandal: NDLEA Nabs Drug Kingpin and Nollywood Filmmaker in Shocking Bust
- Vandals Loot And Set Ablaze NCC Industrial Park In Kano, Sparking Widespread Condemnation
- APC Members Must Prioritize Tinubu’s Re-Election – Keyamo
- Tinubu’s Government Budgets N65 Billion for Ex-Militants’ Reintegration
- APC Vice Chairman Explains Why Shettima Wasn’t Mentioned in Tinubu’s Endorsement*
- Takeaways from President Tinubu’s trip to Riyadh and Hague
- Team Nigeria school sports contingents arrive home after impressive outing at inaugural school sports games
- Power, Corruption, and Fallout: Why Lagos Lawmakers Sacked Speaker Obasa
- New Army Chief Declares War on Terror: Lakurawa Militants to Face the Heat
- Fact-Check: Did Gov Abdulrazaq Really Pay Exam Fees for 55,500 Students? Officials, Principals, and Parents Disagree
- Trump Admin Bans Harvard from Enrolling International Students Amid Campus Controversy
- President Tinubu Nominate Olufemi Oluyede As New Chief Of Army Staff
- OMO’BA OKUNJIMI ODIMAYO: THE SUNRISE THAT DISPELLED IKALE’S LONG NIGHT
- The Federal Government has launched the 2nd phase of the Renewed Hope Employment Initiative (RHEI) in Abuja.
- NCC Directs Telecom Operators to Notify Customers of Major Network Outages
- After Buhari: Atiku and Kwankwaso Jostle for Northern Political Crown in Post-Buhari Era
- NSC Mourns the Passing of Ex Referees Association Chief, Alhaji Tade Azeez
- Dangote Truck Drivers’ Association Warns Against Forced Unionisation Amid NUPENG Threat
- Tinubu Set for Emergency Security Talks as Governors, Generals Clash Over Self-Defense
- Dangote Sells Petrol At ₦990/Litre: What IPMAN’s New Deal Means For Nigeria’s Fuel Prices
- STATEHOUSE PRESS STATEMENT: PRESIDENCY DISCLAIMS 2027 CAMPAIGN BILLBOARDS NATIONWIDE
- Justice or Betrayal? Emotions Run High as Supreme Court Seals Okpebholo’s Victory in Edo”
- Nigerian Police Launch N5.5 Million ‘Keke’ Loan Scheme
- 2027 Polls: APC Governors Dismiss Opposition Threat, Hail E-Registration Drive
- Man Sentenced to Death for Stealing a Fowl Walks Free After 14 Years in Prison
- FG Sets Up Powerful New Committee to Fix Lagos Waterfront Approvals Once and for All
- FG to Train Female Engineers on High-Tech UAV Training to Revolutionize Farming
- Tinubu Approves Retirement Age Increase for Doctors & Healthcare Workers
- FG Allocates N940 Billion to TETFund for 2025 – A Game-Changer for Nigerian Education
- UNICEF and Canada Team Up to Combat Malnutrition in Bauchi with Vitamin A Boost
- Appreciation and Reflections on the Progressive Digital Media Summit.
- Deadly Dynamite Explosion in Niger: Owner Remains at Large, Police Urge Vigilance
- *NSC DG Tasks Aquatic Federation to Organize National Tourney, Applauds Inaugural Swim to Future School Championship*
- IN JOS, PRESIDENT TINUBU ASSURES NORTHERN CHRiSTIANS OF FAIRNESS, AS HE PAYS TRIBUTE TO LYDIA YILWATDA, MOTHER OF THE APC CHAIRMAN
- Scandal Shakes Equatorial Guinea: Top Official Arrested With Over 400 Sextapes Involving VIP’s Wives And Elites
- NSC Pledges Support as Team Nigeria Heads to 2025 All-African Senior Badminton Championship
- Tinubu and Osinbajo Reunite in Tanzania
- National Sports Commission Pledges Support for Lagos Liga’s Vision to Impact Grassroots Football
- Tinubu Cracks Down on Absconded Civil Servants: Refund Salaries and Face Penalties – Yakubu Haruna – Traffic.ng
- NSC announces commencement of Media Accreditation for National Sports Festival in Ogun State
- States Scramble For Independent Power As National Grid Faces Collapse Crisis
- We Need Open Contest, Not Zoning” – Vanguard Group Challenges PDP on 2027 Presidency
- BREAKING: Unknown Gunmen Kill Teenager, Three Vigilantes in Imo Community
- Nollywood In Mourning: Kunle Afolayan Looses Mother At 81, Celebrities Pay Tribute
- The Time for Nation-Building: Choosing Productive Ventures over Disruptive Activism.
- Nigeria and Saudi Arabia Ink Landmark Deal for a Seamless 2025 Hajj Experience
- NSC Hails Nigeria’s Para Powerlifting Contingent for Stellar Performance at World Championships
- NLC President Joe Ajaero Denies Allegations Of Terrorism Financing, Vows To Continue Fighting For Workers Right
- Tinubu Delivers 10 Cutting-Edge Medical Projects at Abuja Teaching Hospital
- 29 Dead, Dozens Rescued After Overloaded Boat Capsizes in Niger State
- Digital Dangers: The Alarming Rise of Technology-Facilitated Gender-Based Violence in Nigeria
- FG’s Bold Plan to Make SME Loans Easier—Here’s What You Need to Know
- NO RELIGIOUS GENOCIDE IN NIGERIA, SAYS PRESIDENT TINUBU IN OWERRI
- BREAKING: Tinubu suspends tax, import duties on wheat, maize, brown rice
- The innuendos about Eric Chelle’s background is the height of deliberate Conspiracy to play down his Coaching competence
- Nigeria to Produce HIV Test Kits & Drugs Locally—Ending Foreign Dependence by 2025
- Tinubu’s monetary policies gradually strengthening the naira, says senior aide, Sunday Dare
- VP Shettima Sounds Warning: Hands Off the Sultan of Sokoto!
- Lagos Cracks Down : 352 Churches, Mosques And Others Sealed For Noise Pollution
- Safe and Welcome: Saudi Arabia’s Assurances to LGBTQ Fans for 2034 World Cup Spark Debate
- Lobi Stars Relieves Coach Agagbe Of His Duties
- Igbo American Veterans Take Bold Stand: Demand Tinubu Orders Nnamdi Kanu’s Immediate Release
- Kaduna SDP Denies Collapsing Structures into ADC, Counters El-Rufai
- Ganduje, Magnus Abe, Afikuyomi, and Other Political Heavyweights Land Top Federal Appointments
- Ali Ndume, the Rant of an Expert in Grandstanding
- Tinubu’s Bold Vision: How His Government Is Transforming Rural Communities
- Senate Gives NNPCL Three Weeks to Address ₦210 Trillion Audit Queries
- NSC congratulates New Record Breaker Joshua Babatunde for longest Hairdressing Marathon
- DSS Screening of SAN Applicants: Turning “Silk” into State Security
- You Paid Bandits Too” — Mahdi Shehu Slams El-Rufai Over Security Criticism
- From Investment to Legacy: Dr. Akin Ogunbiyi’s Drive to Elevate Nigerian Canoeing
- 35 Days to Go: Nigeria Set to Host African Junior Athletics Championship in Abeokuta
- Drama at the Gates: Natasha Storms NASS, Vows Return Amid Legal, Political Crossfire
- Asaba 2025: Lagos State Outpaces Edo, Delta in Medal Rush at National Youth Games
- She Was Smelling : Seun Kuti Fires Back After Aisha Yesufu’s Scathing Attack – What Really Happened Between Them
- President Tinubu, the North and Distortions of Politics
- 20 Days to Go: Five Team Nigeria Starlets to Watch at the African Junior Athletics Championships
- “Trump Holds First Rally Since Shooting: Dismisses Concerns About Democracy”.
- Accidental Leadership – Kukah Claims Nigeria’s Presidents Are Unprepared For Power; Tinubu Defends Himself
- Wike Promises Abuja Will Look Unrecognizable By 2027: Bold Infrastructure Plans Unveiled
- Political Storm: Atiku, ADC Slam EFCC Over Tambuwal Arrest — Agency Denies Being Tinubu’s ‘Attack Dog’
- NSC DG Bukola Olopade Eulogises President Tinubu on the occasion of his 73rd Birthday Celebrations
- Nigeria Flag National Team heads for historic African Championship in Egypt Unveils its competition apparel to the National Sports Commission
- Sunday Dare hosts select APC leaders in Ibadan to strategize on repositioning the party
- CBN Extends Suspension Of Cash Deposit Fees Until March 2025
- CBN Unveils Digital BVN Platform to Unlock $1 Billion in Monthly Diaspora Remittances
- Rivers State Governor Fubara Sets Up Judicial Panel to Probe Predecessor’s Administration
- A New Era For Nigeria’s Economy : From Consumption To Production.
- Issa Hayatou, A Titan Of African Football, Passes On
- APC Reconsiders Ndume’s Senate Whip Position After Apology
- Tinubu to W’African Leaders: Turn Region’s Demographic Strength, Mineral Wealth into Jobs, Industry resident
- Revealed: Plan to Blackmail Pro-Tax Reform Lawmakers, Attack Tinubu over France
- Dangote Refinery capable of solving Nigeria’s forex problems; catalysing economic development, says S&P Global
- Ahead 2024 Olympic Games: Why is Nigeria’s Sport Ministry Silent On The Adopt-An-Athlete Initiative
- Senate Drama: Akpabio Defends Deputy Senate Leader, Dares NDLEA Over Drug Allegations
- NSC DG Bukola Olopade Hails Lagos State as a Leading Sporting Hub in the Country
- Nigeria to Host World Athletics Africa Road Running Conference, as NSC Formulates Organizing Committee
- End of the Road: NDLEA Arrests Notorious Drug Baron After 17 Years on the Run!”
- NELFUND Approves 16 Additional State-owned Schools For Student Loan Scheme.
- Super Falcons Stage Epic Comeback to Clinch 10th WAFCON Crown in Morocco
- 2024-2025 fiscal policy crisis: Project funding, execution stall over poor budget implementation
- JAMB Issues Warning Over Fake UTME Resit Exam Messages
- PDP Crisis: NWC Accused Of Protecting Party BigWig From Sanctions
- Why Nigeria Economic Reforms Are Stuck: IMF Unveils Troubling Trends
- Mele Kyari: The Architect Of Nigeria’s Oil Production Resurgence
- Tobi Amusan Shatters Records: Crowned Fastest Woman in the World at Jamaica Athletics Invitational
- FG Clarifies $21.5bn Borrowing Plan, Engages World Bank, China, EU for Development Financing
- National Showdown: 36 Governors Reject Tinubu’s Tax Reforms Here’s Why The Presidency Is Pushing back
- FBI Finally Nabs $6M Cyber Fraud Kingpin Who Fled Nigeria for Ghana
- NSC Celebrates 29 Year Anniversary of Nigeria’s Historic Olympic Football and Long Jump Gold at Atlanta ’96
- Over 1,000 Insurgency Groups Threaten Africa, Leaders Meet in Abuja
- Run From Baltasar’s Scandal! UK Pastor Warns: Don’t Let Him Drag You Back To Your Dark Days
- IPOB Denies Attacking Truck Drivers In South-East, Says It’s Government Blackmail
- Oyo APC : Still Divided
- Abuja Residents Outraged Over Surprise ‘Entertainment Tax’ in Restaurants and Eateries
- Newlywed Husband Murders Wife in Cold Blood – Neighbors in Disbelief
- Unstoppable D’Tigress Claim 5th Straight AfroBasket Crown, Extend Continental Dominance
- MACBAN Hails Tinubu Over DSS Boss Appointment, New Livestock Ministry Creation
- Akpabio Defends Tinubu: Blames Past Governments For Hardship, Promises Lasting Legacy
- Tambuwal Alleges Tinubu Plot to Weaken Opposition
- BREAKING: Kano Transport Commissioner Ibrahim Namadi Steps Down Amid Drug Bail Scandal
- Obi Cubana Celebrates Wife’s Distinction In Masters Degree: ‘Beauty And Brains’ Shines Through!
- Tinubu Summons Emergency Meeting with GenCos as N4 Trillion Debt Threatens Total Power Blackout
- Asaba Ignites as 9th National Youth Games Showcase Nigeria’s Brightest Talents
- Tinubu’s reforms will save Nigerians, not policy flipflops
- FG Commits $50 Million to Impact Investment Fund, Deepens Partnership with Investors
- IBB’s Regret: Too Little, Too Late
- Prince Fred Akhigbe Congratulates Renowned Sports Journalist Kola Daniel On His Well-Deserved Appointment
- A Rare Gem Shines On: Celebrating Chief Sunday Dare’s 59th Birthday
- Plateau State Police Command Smashes Robbery Syndicate, Recovers Over One Million Naira Snatched From Traders.
- NSC’s Forward-Looking Leadership of Sports Industry Attracting Captains of Industry into Sports
- FG, Partners Unveil $60 Billion Plan for 4,000km High-Speed Rail Across Nigeria
- Tinubu Flags Off 125km Benin-Asaba Highway Without Spending a Kobo
- NSC Congratulates Lookman, Nnadozie, Super Falcons, as Nigeria Shines Bright at 2024 CAF Awards
- Tinubu Orders MDAs to Pay for Use of Renovated ₦39bn Abuja Conference Centre
- Tensions Rise As Court Reserves Verdict On Rivers State LGA Fund Blockade
- NDLEA Foils International Drug Smuggling Ring, Seizes Cocaine and Tramadol Disguised as Prayer Beads and Clothes
- NDLEA Busts N2 Billion Meth Empire Hidden in Auto Parts from Canada
- Minister’s 6,000MW Power Promise In Peril As National Grid Collapses Again: Can Nigeria Overcome the Crisis?
- Zamfara Victory: Troops Crush Terrorists in Daring Ground and Air Assault
- Victory for Commuters: Abuja-Keffi Road Rehabilitation Secured After Lawyer’s Legal Threat
- Tinubu Snubs GAC Meeting For Failing To Reinstate Obasa As Speaker, Orders Immediate Compliance’
- FG Approves 11 New Private Universities
- Honouring a Remarkable Leader: Eulogizing Hon. Sunday Dare, CON
- Senate Set To Approve Tinubu’s $2.2 Billion Loan Amid Bold Budget Moves
- Pantami Urges FG to Reward TeenEagle Champion Nafisa Like Super Falcons, D’Tigress
- Sunday Dare Blasts Obasanjo: He Wasted $16bn To Generate Darkness And Ran The Most Corrupt Presidency
- MIGHTY JETS ENGAGE ERE DOKUBO AS TECHNICAL ADVISOR. By Yemi Kosoko, Jos
- From Terrorist to Rebel Leader: Jolani’s Victory Speech Sends Waves to Iran, Trump, and Israel
- NSC Constitutes Organizing Committee for 3rd African U18/U20 Athletics Championships*
- One Day to Go: 35 Countries Arrive Nigeria for 3rd CAA U18/U20 African Athletics Championship
- Official: Chelsea appoint 56-capped ex-Super Eagles midfielder to talent management role
- PRESIDENT TINUBU PARDONS HERBERT MACAULAY, VATSA, LAWAN, GRANTS CLEMENCY TO 82 INMATES
- The Federal Government has approved the long-awaited pensions for retired aviation workers, including former staff of the defunct Nigeria Airways.
- 12 Ways the Economy Has Changed Structurally
- Tinubu’s Bold Move: Meet Nigeria’s New Health Insurance Boss
- NIMASA Elevates 9 Deputy Directors to Directors, Promotes 234 Other Staff in Major Shake-up
- Diplomatic Embarrassment: Japan Denies Tinubu Govt’s Claim of Special Visa for Nigerians
- 5 Days to Go: Dare, Gumel, Ogba, Other Top Dignitaries to Storm Abeokuta for Athletics Championships*
- Ooni hosts Soun, advocates for a united Yoruba nation, Nigeria
- NSC Charges D’Tigers to go For Gold, as Team Jets Out to Angola for 2025 FIBA AfroBasket
- Transforming Agriculture: Green Money Project Calls for Young Nigerian Agripreneurs
- Mystery in Abuja: Ex-Immigration Boss Found Dead in Hotel Hours After Female Guest’s Visit
- EFCC Cracks Down: 27 Officers Dismissed for Fraud and Misconduct in 2024
- PRESIDENT TINUBU CHANGES SERVICE CHIEFS
- World Athletics Confers Nigeria with Hosting Rights for Inaugural Africa Running Conference*
- NSC ORGANIZES SUCCESSFUL ELECTIONS FOR 16 SPORTS FEDERATIONS AS NEW PRESIDENTS EMERGE FOR THE NEXT FOUR YEARS
- Fubara Bows to Supreme Court, Invites 27 Lawmakers for Peace Talks
- Nigeria’s Police: Protectors or Predators? UK Leader Kemi Badenoch Shares Shocking Experience
- PRESIDENT BOLA TINUBU – LEADING WITH PURPOSE AT 73 AND BEYOND
- President Tinubu Greets General Ibrahim Badamasi Babangida At 83
- China and Nigeria Forge Stronger Ties: Wang Yi’s Landmark Visit to Abuja
- EFCC Holds Tambuwal Over Alleged Diversion of ₦189bn From Sokoto Coffers
- Beaded Crown: Former Minister Sunday Dare Congratulates Oba Rashidi Ladoja
- Now That The Chinese Bilateral Talks Are over, I Hope President Tinubu Leaves Beijing With Big FDI Guarantees. He Should Now Turn His Attention To The UK And Seek Investment In The Shipping Sector As Atonement For Colonialism
- EFCC Boosts Student Loan Fund With N50 Billion Recovered From Looters
- 915 Alayande Varsity Scholars Secure NELFUND Loan
- Time For Atiku Abubakar To End His Grand Illusions And Fantasies
- Hardship Protest: Before We Make Our Own Ukraine And Create A Kenya In Our Land.
- FG to Revoke Dormant Oil Wells as Tinubu’s Govt Cracks Down
- NSC DG Bukola Olopade Congratulates NBBF Boss Musa Kida for new appointment as NNPC Chairman
- Tinubu-Buhari partnership and opposition’s desperate search for validation
- FG Vows To Shutdown Filling Stations Hiking Petrol Price
- Tinubu committed in promoting Digital media
- Mahama’s Stunning Comeback: How Ghana’s Election Sets a Democratic Gold Standard.
- Trump Slams Hysteria: Elon Musk Can Never Be President, Here’s Why
- Lagos State to host historic first National Sports Commission Intermediate Games in 2026
- FG Brings 24-Hour Solar Power to 24 Tertiary Institutions
- Nigeria’s Minister of Sports Development, John Enoh issues apology poor outing
- Stage Set for 9th National Youth Games as 6,382 Athletes and Officials Confirm Participation
- PRESIDENT TINUBU TO VISIT PLATEAU STATE
- U.S. Slaps 14% Tariff on Nigerian Goods—IMF Warns It Could Wreck Global Economy
- Shehu Sani Defends Tax Reform Bill: Calls For Merit-based Debate, Not Regional sentiments
- Nigeria Seeks Billions for Green Energy—Islamic Bank Steps In!
- West Africa’s Security Crisis: How ECOWAS Crackup is Fueling Terrorism
- New Look, Renewed Morale: Nigerian Police Approves Distribution of New Kits and Uniforms
- EU Pumps €46 Million into Nigeria’s Social Welfare—Here’s Who Benefits
- FG Approves Bold New Electricity Policy to Transform Power in Nigeria
- Removal Of Subsidy Not Cause Of Fuel Price Hike – TUC President, Osifo
- Okowa Speaks Out Amidst EFCC Probe: “It’s Unfortunate, But I Am Ready”
- No Court Can Prevent EFCC from Prosecuting Ex-Governor Yahaya Bello for Alleged Theft of N84b – Falana
- Political Showdown in Rivers: Assembly Rejects Fubara’s Commissioners, Issues 48-Hour Ultimatum!
- NIGERIA REVENUE TRAJECTORY IS ON TRACK. SHOWS MOST SIGNIFICANT HALF YEAR IMPROVEMENT AT 43% ₦14.27 trillion as at (January–June 2025)
- Governor Adeleke Jets Off to the U.S. for Davido’s Star-Studded Miami Wedding
- Donald Trump ’s Plan To De-Stabilise Nigeria
- Engage Our Adversaries With Gallantry, Sophistication, Tinubu Charges Armed Forces
- *”Tinubu is detribalized, more appointments will increase balancing, equity to all regions”* says Hon. Sunday Dare.
- Kizz Daniel Hails Olamide As Music Godfather, Reveals How Don jazzy And Phyno Shaped His Carreer
- Dasuki Pushes for Forfeited Abuja Estate to House Military Heroes
- FG Creates 240k Jobs, Supports 10 MSMEs Hubs
- IMF says Nigeria must raise revenue, fix budget to support growth
- NCCE Boss Urges Data-Driven Education Leadership
- Tinubu Approves New Federal University for Southern Kaduna Amid Promises of Roads and Progress
- Atiku Slams El-Rufai Police Summons, Warns of Rising Authoritarianism
- Embracing Dialogue: A Call to Nigerian Youths on International Youth Day – Chief Sunday Akin Dare
- Nigeria’s Power Generation Hits Record 6003MW Under Tinubu
- Tinubu Challenges ECOWAS Leaders: Follow Ghana’s Lead in Democratic Excellence
- FG Launches Super Grain to Save Millions from Malnutrition
- FG Offers N120 Billion to Companies That Can Train 60,000 Youths in Just 3 Months
- 23 Surprising Facts About Tinubu’s Tax Reform That Could Change Everything
- AfDB Unveils Bold Strategy to Boost Nigeria’s Agriculture and Infrastructure—Here’s What You Need to Know
- NSC Chairman, Shehu Dikko to Declare Niger Delta Sports Festival Open, as Commission Backs Initiative
- From Lagos to Sao Paolo… Abuja to Brasilia… Nigeria and Brazil share more than history. We share a future.
- Wike’s Masterstroke: A Festival To Foil Protesters Plans
- 2027: PDP’s Zoning Gamble to the South Stirs Northern Backlash
- EFCC Grills Ex-Gov Udom Emmanuel Over Shocking ₦700bn Fraud Allegations
- Court Dismisses Emefiele’s Application to Reclaim Forfeited Estate
- Tinubu Leaves Japan, Heads to Brazil for Landmark State Visit
- INEC CHAIRMAN: MAKING A DIFFERENCE — A CHOICE UNANIMOUS By Sunday Dare
- Revolutionizing Nigeria’s Tech Industry: VP Shettima Hails SecureID’s Groundbreaking Innovations on 20th Anniversary
- Peter Obi’s Speech On Waging War Raises Security Concerns
- How Nigeria’s Gas Revolution is Quietly Changing Everything
- FG Partner AfDB to Supercharge Nigeria’s Economy and Create Over 1.5 Million Jobs with $650 million annually
- PRESIDENT TINUBU MEETS CHAIRMEN OF GENCOS, PLEDGES TO RESOLVE LONGSTANDING DEBT CLAIMS
- Tinubu appoints member Federal Character Commission
- Tinubu’s $1 Trillion Economy Plan Gets a Boost
- New Emir of Zuru Pledges Commitment To Serve People and Government of Kebbi. By Yemi Kosoko
- React : Deconstructing and Educating Lara Logan: Nigeria’s Story Deserves Truth, Not Western Propaganda
- High-Level Engagement: CRDCU and NSC Discuss Sports Sector Reforms
- NIGERIA :WHY BRAZIL. YES, BRAZIL.
- Nigeria Revamps Education System With 15 New Skill Acquisition Programs
- PDP Sets 2027 Power Grab In Motion: ‘We’ll Wrestle Power from APC’ – South-East Leader
- Benue Gov Suspends Aide Over Sextortion, Cyberbullying Allegations
- Nigerian Police Foil Attack, Recover Weapons in Kogi Forest
- President Tinubu’s National Youth Conference, A Golden Opportunity
- Nationwide Protest;- NBA Appeals For Calm.
- From Oppositiin To Power :The Erosion Of Progressive Ideals In Nigeria Politics
- OGUN SHUTDOWN: NLC Strike Grounds Courts, Ministries Over Pension Crisis
- Ministry of Defence Promises Housing Solutions for Ex-Servicemen
- NSC Motivates D’Tigress with Improved Welfare Incentives, as Coach Wakama Unleashes 12 Tigresses for 2025 Women’s AfroBasket
- FG’s Renewed Hope Jobs Scheme Begins to Deliver Big Wins
- PRESIDENT TINUBU APPOINTS RINSOLA ABIOLA AS DIRECTOR-GENERAL OF CLTC; NASIR BALA AS AIDE ON CITIZENSHIP AND LEADERSHIP
- GOVERNOR MUTFWANG CELEBRATES MRS STELLA DIN JACOB’S APPOINTMENT AS EDITOR-IN-CHIEF OF TVC
- Chinese Envoy Calls for Commitment to UN Principles, Warns Against Unilateralism
- Nigeria Set to Receive $3 Billion Telecom Boost by June – Minister Announces
- Yahaya Bello’s Travel Bid Denied Again as Second Court Rejects Passport Request
- Nigeria Pledges $100 Million to ECOWAS Bank in Major Push for West Africa’s Development
- UAE Announces 5-Day Immigration Office Closure Ahead of Eid Al Adha
- RE: TOO LITTLE, TOO LATE: The Frankenstein Lamentations of Generals
- Kaduna State Security Council Enforces 24-Hrs Curfew In Kaduna And Zaria Metropolitan Areas
- How FG Is Quietly Equipping Nigerian Farmers for a Global Export Takeover with 4,633 Seedlings and a $50M Boost
- President Tinubu is a Youth Friendly leader – former Minister Dare
- Northern Youth Alliance For Good Governance Pulls Out Of Protest
- Pomp, Pageantry, and Performance: CAA U18/U20 Championships Ends on a High in Abeokuta*
- NANS Denounced “Faceless” Strike Commends Government On Students Loan Initiative
- Wilfred Ndidi Honoured After Reaching 200 Premier League Appearances
- Multiple Casualties Feared as Another Boat Capsizes in Sokoto
- ”Africa’s Future Depends on Strategic Leadership and Infrastructure” – Odetola Declares at Olin Africa Business Forum*
- Sunday Dare Congratulates Amaju Pinnick on New CAF Appointment
- LAGOS BEGINS “CATCH-THEM-YOUNG” MULTI-SPORTS TRIALS AHEAD OF 2025 NATIONAL YOUTH GAMES
- No-Show in Abuja: Protesters MIA Despite Bold Claims by Farotimi Supporters
- WAEC Temporarily Pulls 2025 WASSCE Results After Detecting Technical Glitches
- 2027: Atiku, David Mark, Secondus, other PDP leaders meet, urge opposition parties to join coalition
- 2027 Bombshell: ACF Dumps Tinubu, Endorses Northern Presidential Candidates
- ACF Suspends Chairman Over Anti-Tinubu Comments; Afenifere, Others Rally Behind The President
- FORMER SPORTS MINISTER DARE MOURNS DEMISE OF FEDERAL LEGISLATOR, AKINREMI
- Ten Years Ago, President Jonathan’s Confab Recommended the New-Old National Anthem– Ajulo, SAN
- Protesters Storm UAE Embassy, Demand Mele Kyari’s Deportation Over Oil Sector Scandal
- Nigeria’s Governors Seek Bigger US Deals on Economy, Governance, and Health
- Telecoms Workers Set To Embark On Nationwide Strike Over Unfair Labor Practices
- 2027 Governorship: Enugu East Declares ‘One Good Turn Deserves Another,’ Adopts Peter Mbah as Sole Candidate
- 30 Days to Go: Okocha, Kanu, Adebayor Lead Star-Studded African Legends Squad for Champions Cup Clash Against Barça Legends in Abuja
- Parties Trade Blame as Police Probe El-Rufai for Criminal Conspiracy
- Ady Macauley Breaks New Ground in Kono Dorgboi, Strengthens Bid for 2026 APC Flagbearership
- ONDO GOVT APPROVES N3.5B COUNTERPART FUNDING FOR RAAMP, WORLD BANK RURAL ROAD PROJECTS
- Nasir El-Rufai’s Scorched-Earth One-Man Opposition
- Trump’s Order Sparks Family Planning Crisis in Bauchi and Beyond
- CBN Hikes Interest Rate To 27.5% Amid Bold Economic Moves
- Delta Governor Oborevwori Slams Defection Rumors: ‘I’m PDP, Through and Through
- FG $27.3M Gas Deal Set to Transform Northern Nigeria
- Nigeria @ 65: A Legacy of National Excellence and Sporting Glory
- As African pop crests again, women are leading the second wave
- Drama Ends As Njoku Accepts Supreme Court Verdict On APGA Leadership
- Security Seal off Lagos Assembly
- Super Eagles Captain Troost-Ekong Set to Join Saudi Side
- Fuel for Thought: Dangote Praises Tinubu as PMS Prices Drop in Game-Changing Deal
- FG Secures N250 Billion to Solve Nigeria’s Housing Crisis
- PRESIDENT TINUBU DEPARTS JAPAN FOR BRAZIL
- Tinubu Approves Diversion Of NNPC Dividends To Fund Petrol Subsidy, Suspends 2024 Payments
- Match Preview: D’Tigers Set Sight on Devouring Madagascar in 2025 FIBA AfroBasket Opener
- Tobi Amusan has finally been cleared by the Court of Arbitration for Sport (CAS)
- Lagos Resists Dynasty Politics: PDP Rejects Seyi Tinubu’s Governorship Ambitions
- FG Achieves 42% Milestone on Abuja-Keffi Road Expansion, Targets June 2026 Completion
- President Bola Tinubu has approved N70,000 as the new minimum wage for workers in the country.
- Tinubu’s tax reforms end a 10-year multiple taxation crisis – NECA
- Showdown Looms as DSS Threatens X Over Sowore’s Anti-Tinubu Tweet
- Nuhu Ribadu – The Unsung Hero Behind Nigeria’s Security Curtain; By Frank Anthony
- I look forward to President Tinubu using the forthcoming June 12 celebrations to make a radical announcement like telling the whole world that Nigeria will be hosting Festac 2027 to show that she is open for business
- STATEMENT BY HIS EXCELLENCY, BOLA AHMED TINUBU, PRESIDENT OF THE FEDERAL REPUBLIC OF NIGERIA, ON THE CESSATION OF THE STATE OF EMERGENCY IN RIVERS STATE
- FG seek investments in ports, digital platforms to aid cross-border businesses across West Africa
- PRESIDENT TINUBU HAILS ETSU NUPE ON 73RD BIRTHDAY, 22ND YEAR ON THE THRONE
- Ajaokuta Steel: Workers of 45-Year Dormant Plant to Earn ₦6 Billion in 2025 Salaries
- Wike Declares Abuja’s Park And Pay Policy Illegal, Vows To Investigate
- THANKS TO THE REFORMS UNDER PRESIDENT BOLA TINUBU NIGERIA IS NO LONGER WHERE IT USED TO BE. 12 NUGGETS TO CHEW ON
- FG Launches Selection Process for Five Permanent Secretaries, Targets New Ministries
- PDP Crisis Deepens as Wike Camp Rejects Zoning Talks with Makinde, Diri
- As Ndigbo receive President Tinubu in Owerri this Tuesday
- Troops Free Nine Kidnap Victims in Sokoto, Crush Terrorists in Zamfara Ambush
- Drama At 30,000 Feet: Bobrisky Removed From Amsterdam-Bound Flight Amidst Arrest Warrant
- Police Declare British National Wanted For Alleged Plot To Overthrow Tinubu’s Government
- Tinubu Delays N47.9 Trillion 2025 Budget Presentation to Wednesday”
- When Daughters Sell Sex and Uncles Buy It: Nigeria’s Unspoken Scandal
- CBN Directs Banks To Transfer Dormant Account Funds.
- JUST IN: Supreme Court orders Federal Government to pay allocation directly to LGAs
- BREAKING: FG Launches Free Business Registration for 250,000 Small Businesses — MSMEs to Save ₦3 Billion
- Tinubu Defies 36 Governors, Insists On Pushing Ahead With Tax Reform Bill
- PRESIDENT TINUBU ENDS VACATION AHEAD OF SCHEDULE, RETURNS TO ABUJA TOMORROW
- 50% Call Tariff Hike: Nigerians to Spend a Jaw-Dropping N6.74 Trillion on Phone Calls by 2025
- FG Moves to Clamp Down on Illegal Satellite Campuses in Federal Tertiary Institutions
- Ex Minister Sunday Dare Attends Sportsville Awards.
- Lagos Partners GreenPlinth to Distribute 8 Million Clean Cookstoves
- Kings and Imams in Yorubaland
- President Tinubu Delivers Midterm Address, Highlights Economic Reforms and National Progress
- Enugu-Beyond the Visit. A President’s Vision for a United Nigeria
- Nigeria Pushes for Grey List Exit with 730 Terrorism Convictions, FATF Reviews Progress
- From Harassment Claims to Political Feud: The Explosive Drama Unfolding in the Senate”
- President Tinubu To Embark On Economic Diplomacy Visit To China
- THE “NORTH” AND ITS FALSE CLAIMS “Na True I Wan Talk Again o”
- Time to Build the Team that will build Nigeria
- The Renewed Hope Ward Development Programme to empower 8.8 million entrepreneurs Set to take off
- NSC Leadership Driving Nigeria’s Sporting Renaissance Under President Tinubu’s Renewed Hope Mandate
- Festus keyamo Sets The Record Straight On Living Faith Church’s Airstrip License – House Of Reps Never Requested Revocation
- Dangote Strikes Again: US Crude Shipments Resume After 3-Months Pause
- Shocking MFG Freezes Simon Ekpa’s Assets, Names Him a Terrorism Financier
- SETTING THE RECORD STRAIGHT: PRESIDENT TINUBU’S ROLE IN THE JUNE 12 STRUGGLE
- UK Prime Minister Keir Starmer Denounces ‘UK Protests asThuggery’ Amidst Widespread Unrest
- NGX, SEC Strengthen Nigeria-China Investment Ties Through Capital Market Diplomacy
- How the Continent Can Become the World’s Biggest Success Story in 40 Years
- NSC top-guns salute Nigeria U19 Cricket team for historic achievements at T20 World Cup in Malaysia
- ASUU directs members to begin nationwide strike
- No More Visa on Arrival, FG Tightens Borders with New Security Measures
- Shocker in Edo! Okpebholo Cleans House: Fires Perm Secs, Suspends Revenue Collection
- PRESIDENT TINUBU HANDS OVER ECOWAS LEADERSHIP TO SIERRA LEONE’S PRESIDENT MAADA BIO, CALLS FOR VIGILANCE, UNITY, AND INCLUSIVE GROWTH
- ADC Surges Past 800,000 Members in Rivers, Welcomes Amaechi, Secondus, and Other Political Heavyweights
- Death Row Crisis: 3,688 Inmates Await Execution as Governors Stall
- Honourable Sunday Dare Charges Odunayo Adekouroye to Clinch Gold at Paris 2024 Olympic Games
- Kano Emirate Drama: Court of Appeal Freezes Sanusi’s Reinstatement
- Trump’s First Big Move : Meet The Woman Making History As His Chief Of Staff
- Yilwatda’s Emergence Will Deepen Internal Democracy – APC UK
- Race for Nigeria’s Next Accountant-General Begins: Who Will Take the Helm?
- The Battle for Nigeria’s Soul: If We Leave Tinubu to Fight Alone, We All Lose
- Biafran Group Hires Ex-U.S. Congressman for Lobby Push
- Nigeria’s BRICS Partner Status and Initial Gains
- National Sports Commission Inaugurates Board for E-Sports Federation of Nigeria
- No TIN, No Mercy: New Withholding Tax Rules Unveiled for Small Businesses
- Ododo Greenlights Game-Changing Laws, Vows People-First Governance in Kogi
- AKINWUMI ADESINA’S CLAIMS ON NIGERIA’S GDP PER CAPITA: THE FACTS TELL A DIFFERENT STORY
- Arokodare Strikes to Keep Nigeria’s World Cup Dream Alive
- FG Sets 12 as New Minimum Age for JSS1 Admission in Private Schools Abuja
- Nigeria Finally Lands Historic Deal with Caribbean Nation After 20 Years of Waiting
- Obasanjo Drops Bombshell: Buhari’s Government Was the Worst in Nigeria’s History
- Nnamdi Kanu: N1bn suit against FG dismissed by court
- Tinubu Hails Nigeria’s Democratic Progress Since 1999, Says System Has Risen from the Ashes
- Tinubu Declares Culture as National Strength, Backs New Alaafin’s Reign Amid Grand Coronation
- Tinubu Appoints Governing Councils and Key Officers for Federal Universities
- Uncertainty Grips Police Force As IG Egbetokun’s Retirement Looms
- CAF Slaps Libya With Another Sanction Amid Airport Saga Appeal Against Nigeria – Will This Be The End?
- CHIEF OF DEFENCE STAFF RENEWS JOINT SECURITY TASK FORCE MANDATE ACCOMPANIED WITH NAME REBRAND.
- 2027 Showdown: APC Claims It Will Be Very Difficult To Unseat Tinubu Here’s Why
- Oxford UN Judge Jailed After Keeping Maid as Slave in Shocking Modern Slavery Case
- FG Stops Bailing Out Broke States
- I want to be Nigeria’s first female vice-president — Fateemah Mohammed
- Los Angeles Inferno: 24 Dead, Prisoners Paid $1 an Hour to Battle Blaze
- Police, INTERPOL Secure Extradition of Nigerian From UAE in $307,500 Fraud Case
- Kogi State Clears N98.8 Billion Debt in 15 Months
- KEYNOTE ADDRESS BY SUNDAY DARE AT THE MEDIA TRANSFORMATIVE GROUP SUMMIT FOR NIGERIA @65 WITH THE TOPIC:Rule of Law: Systemic Problem. The Way Forward
- IMF Warns Tinubu: Stabilization Alone Won’t Stop Hunger—Vulnerable Nigerians Need Urgent Support
- THE INSIDER: Bash Ali and his dirty tricks against Sunday Dare -exposed by documents
- X-Raying NSC DG’s Remark: “All Sports and Federations Hold Equal Importance” – Hon. Bukola Olopade
- I Spent My Entire NYSC Allowance on a US Visa—Only to Be Denied” – Nigerian Lady Shares Heartbreaking Experience
- Varsity Shutdown Continues: Talks Between FG And Striking Workers Collapse
- Africa’s $777bn Pension, Insurance Assets Hold Key to Infrastructure Boom — AFC
- Tinubu’s Security Shake-Up: A Deliberate Move for Agility and Renewal — Sunday Dare
- Tinubu Rewards 200 Outstanding NYSC Members with Jobs, ₦250K Each, and Scholarships
- $100 Million Youth Bank Set to Turn Nigerian Hustlers into Millionaires — AfDB Unveils Game-Changer for Africa’s Young Entrepreneurs
- Dangote Refinery Slashes Petrol Price To N970 Per Litre
- Ogun housewife stabs husband to death for alleged infidelity
- PUBLIC DISCLAIMER: I disassociate myself with Sadiq Fakai – Shafa’atu
- Luxury Heist Unveiled: Nigeria Customs Returns 21 Stolen Vehicles Worth N1.8 Billion To Canada
- Nigerian Students Hit Hard as UK Slashes Post-Study Visa and Tightens Immigration Rules
- Saudi Arabia Bets Big on Nigeria: $1.2 Billion Livestock Investment Set to Revolutionize Agriculture
- FG to Close Lagos’ Ijora Bridge April 27 for Major Repairs
- He was a consummate politician and philanthropist_Former Minister Sunday Dare Mourns Late Rep, Akinremi Jagaban.
- Saraki Slams Akpabio: Stop Playing Politics with Sexual Harassment Allegations
- INEC Proposes Game-Changing Shift: PVCs No Longer Mandatory for Voting”
- Former Minister Sunday Dare Pays Tribute To Late Oyo APC Chair, Omodewu
- Enugu Rangers Crowned Champions in Jos, Doma, Gombe, Sporting, Heartland Relegated
- TCN Debunks Grid Collapse Rumors
- Nigeria’s $1 Trillion Dream: How the Senate is Paving the Way for an Economic Boom
- Kaduna Moves Swiftly as Abuja–Kaduna Train Derails, Passengers Rescued
- 2027 Elections: Goodluck Jonathan Meets IBB in Private Talks Amid Rising Political Speculation
- President Tinubu Approves ₦4 Trillion Power Sector Bond to Solve Nigeria’s Electricity Crisis
- NBA Applauds Dangote for Slashing Petrol and Diesel Prices
- NATIONAL SPORTS COMMISSION PRESS AND PUBLIC RELATIONS UNIT
- Trump Celebrates First American Pontiff, Hints at Historic Vatican Meeting
- Former Kogi Governor Yahaya Bello Walks Free After Meeting Bail Conditions
- Nigerian Government Axes Foreign Scholarship Program.
- How Vice President Shettima and Governors Honored Nigeria’s Fallen Heroes on Armed Forces Remembrance Day 2025
- Nigeria Still Drowning in Corruption” — Clerics Slam Tinubu Over Brazil Comment
- Meta, WhatsApp Hit with $220m Penalty Over Data Privacy Violations in Nigeria
- No Bail for Simon Ekpa: The Shocking Reasons Behind Finland’s Decision
- Oba Adedokun Omoniyi Abolarin Counsels Young Nigerians
- Amaju Pinnick’s new role in FIFA is a testament to his huge influence in global football – NSC DG Bukola Olopade
- EXPOSED: The Viral Video That Landed Nigerian Whistleblower Shehu Mahdi Behind Bars
- Babachir Lawal; our latest political content creator – Sunday Dare
- FG Rolls Out N30bn Mechanised Farming Boost for Agriculture Varsities: Big Wins for Education and Food Security
- COMMANDING FROM THE FRONT : PRESIDENT TINUBU IS STRENGTHENING NIGERIA’S NATIONAL SECURITY ARCHITECTURE By Sunday Dare
- Lagos Airport Runway Shut Down Again—Just Weeks After Reopening
- Africa Deserves a Seat at the Table: Nigeria’s Bold Bid for UN Security Council Membership
- We Paraded Fake Membership Numbers For 2023 Polls – APC National Scribe
- N1.3tn Fraud Scandal: Former Delta Governor Okowa Spends Second Night In EFCC Custody
- Tinubu Hails Soludo’s Re-Election as Proof of Visionary Leadership
- Art for Governance as Novel Approach to Gender Inclusion in Leadership
- Senate Approves N1.7 Trillion 2025 Budget to Power Abuja’s Mega Infrastructure Push
- 35 Days to Go: Ronaldinho, Saviola, Giuly, Others, Amongst First Barca Legends to Officially Confirm Participation for Champions Cup in Abuja
- NSC Drums Support for Junior D’Tigress, as Team Settles in Czech Republic for FIBA U-19 Women’s World Cup
- **Access Bank Lagos City Marathon: 10 Years of Excellence with 600,000 Athletes from 14 Countries Covering 42,000 KM**
- Nigerian President to Attend Historic Inauguration of Pope Leo XIV
- BREAKING: Nigeria Mourns Again — Awujale of Ijebuland, Oba Sikiru Adetona, Dies at 91 After 65 Years on the Throne
- From Paystack to Precision: How Temi Giwa’s ‘Tru’ is Redefining Fitness Tracking with Style
- Tinubu Set to Unveil N47.9tn 2025 Budget: Here’s What to Expect on Tuesday”
- NFF BEGINS SEARCH FOR A FOREIGN TECHNICAL ADVISER TO RESCUE SUPER EAGLES FADING 2026 WORLD CUP TICKET.
- Senate Probes Cameroon’s Alleged Takeover of Oil-Rich Territories
- Nigeria’s Inflation Falls to 22.22% in June, Lowest in Over a Year — NBS
- FG Shuts Down Waterway Between Eko and Carter Bridges After Dredger Wrecks Bridge Support
- ASUU Threatens Nationwide Strike Over Unfulfilled 2009 Agreement with FG
- Ndume Commends Tinubu for Appointing Northerners to Strategic Federal Roles
- Sunday Dare Lauds NSC, Dapo Abiodun for Stellar Opening Ceremony
- Russia Secretly Deploys Thousands Of North Korean Troops To Support Ukraine War Effort
- Reuben Abati’s Unprovoked Anti-Igbo Trade: Claims Yoruba Can’t Buy Land In The South-East
- Riyadh 2025: Nigeria’s Boxing Contingent Departs for Saudi Arabia
- US cuts Nigerians’ visa validity to three months
- NELFUND Takes Historic Step Towards Empowering Students with Inaugural Board Meeting
- Visa Braggadocio and the Illusion of Power: Nigeria’s Strategic Autonomy as the Answer
- FG to Publicly Name Corrupt Procurement Officers in Contract Scam Crackdown
- Tinubu Vows Balanced Development: “No Region Will Be Left Behind”
- Presidential Spokesman, Sunday Dare to Grace Opening Ceremony of National Sports Festival in Ogun State
- EFCC Arrests Ex-NNPCL Top Officials For Alleged $7.2bn Fraud
- Dramatic Standoff Halts Attempt to Arrest South Korean President Yoon Suk Yeol
- IPOB Reportedly Offers N1 Million Bounty on Security Officers in Southeast
- Seyi Tinubu: A Victim of Cyber Bullying and Political Desperados
- FG Launches Game-Changing e-Visa System Starting May 1st
- 2025 Budget Warning : This A Political Document, It Can’t Be Implemented
- Tunde Ednut Questions Why UK Doesn’t Hire Nigerian Pastors Like Doctors, Yul Edochie Sparks Outrage With Response
- Budget Breakdown: 13 States Commit N3.87tn To Salaries And Overheads In 2025 – Who Is Really Winning?
- I Hope President Tinubu’s MoU With China Reaffirms Nigeria’s Commitment To Beijing’s Belt And Road Initiative With A Caveat That Will Supply Them With Tropical Crops In Exchange For Investment In Our Infrastructure
- Akpabio Fires Back: “Natasha Lied About Court Order – It Was Political Theatre, Not Senate Business
- FG Empowers 270 Technical Teachers with Digital Skills
- Tinubu Tax Reforms: The Debate Over Tinubu’s Proposed Bills
- Why You Shouldn’t Watch Baltasar Engoga’s Leaked Tapes: Nigerian Mum Warns Amid Scandal
- Tax Revolution : Oyedele Unveils Bold Reforms To Empower “Tax Revolution: Oyedele Unveils Bold Reforms to Empower Nigerian Youths And Ease Living Cost
- Nigerians Start Earning US Dollars From Home!
- Iran and Israel exchange strikes after Tehran rules out nuclear talks while under attack
- 15 Days to Go: Emmanuel Adebayor Relishes Opportunity to Play in Nigeria as Barca Legends vs African Legends Clash Nears
- Operation Delta Sanity II: Navy Smashes 10 Illegal Refineries in Niger Delta Blitz
- Atiku Slams Tinubu: Your Policies Are Killing Nigerians
- S’Eagles: Finidi to be in charge till 2026, NFF reveals
- 161 Million Nigerians Face Hunger: Government Scrambles to Avert Full-Blown Nutrition Crisis
- NFF Owes Super Eagles Coach Eric Chelle Four Months’ Salary, Bonus
- Breaking: UniAbuja Renamed to Honour Former Head of State Yakubu Gowon – See Why
- The Architect Of Renewal: The Bola Ahmed Tinubu Story, Reviewed By Sunday Dare, Special Adviser To President Bola Tinubu On Media And Public Communications
- FG Unveils N5 Billion Fund to Empower Women Across Nigeria
- BIG WIN FOR RETIREES: PFAs Now Have Full Control Over Pension Payments—No More Delays
- From Chicken Theft to Redemption: Pardoned Osun Convicts Set for Freedom Tomorrow
- Empowering Nigeria’s Tech Aspirants: Codeflex Launches First Paid Coding Bootcamp with 95% Scholarship
- Nigeria’s 2025 Tax Law: Clearing the Fog of Misinformation of Beer Palour Talks
- Coronation: Former Minister Sunday Dare Congratulates Olubadan, Oba Owolabi Olakulehin
- Bankole, Ovoke, 30 Others Called To Super Eagles B Phase Two Camp For Ghana-Nigeria Clash
- Davido At 32: OBO Donates 300M To Charity, Spreads Hope Across Nigeria
- Atiku’s Resignation Roils PDP, Sparks Realignment
- Nigeria’s Energy Crisis: The Silent Killer Of Industrial Growth, MAN Warns
- Tinubu’s Return Sparks Cabinet Shake-up Fears: Ministers Brace For Reshuffle
- Shots, Fired! Reno Trolls Peter Obi
- The ‘Quiet Giant’ Transforming Nigeria’s Power Sector with Billion-Dollar Moves
- ECN Commissions 7MW Solar Power Project at Aminu Kano Teaching Hospital
- Hush-Money Case: Sentencing Set Just Days Before Inauguration – No Jail Time Expected
- NSC Applauds Eniola Bolaji on Gold Medal Victory at 2025 British and Irish Para-Badminton International
- CBN Defends Naira with US$4.7bn in First Half of 2025
- Team Nigeria Unveils Official Squad for 3rd African U18/U20 Athletics Championship
- Montpellier Striker Adams Akor Knocking On Super Eagle’s Door
- Massive Takedown: 96 Terrorists Killed, High-profile Commander Captured In Explosive Military Operation
- Fabura VS Wike: PDP Backs Out Of Rivers LG Election
- NSIB LAUNCHES INVESTIGATION INTO ABUJA-KADUNA TRAIN DERAILMENT
- TINUBU TO COMMISSION LEGACY PROJECTS IN IMO STATE
- Chief Asonja celebrates Gbajeniyi of Egbaland
- NYSC Set for Major Overhaul as FG Inaugurates Reform Committee
- Peter Obi Declares: “One Term Is Enough. Leadership Is Not a Life Sentence”
- From Kano to the Future: Barau Sends 70 Youths to India for AI and Robotics Studies
- PRESIDENT TINUBU RALLIES WEST AFRICA TO A NEW VISION OF INTERGRATION. AFRICA MUST NOT MISS THE NEXT INDUSTRIAL REVOLUTION
- Breaking: Benue: State of Emergency Looms As Benue descends into Massive killings
- No New States Approved – Senate Clears Air, Plans Tribute for Buhari
- IBADAN – For President Tinubu, a homecoming and a resound of history
- China Breaches U.S. Treasury in Major Cyberattack: What We Know So Far
- Bello: How I Sold My Home and Turned Birthday Gifts Into a 540-Seater LASU Auditorium
- Joe Biden Withdraws from US Presidential Election Race
- Meet Victor Collins, The Only NPFL Player In The Super Eagles Camp Ahead Of AFCON Qualifiers
- Chan Eagles Watch : Nasarawa United’s Victor Collins Impresses At Eagles Training Camp
- FG’s Billion-Dollar Plan to Turn Abandoned Buildings Into Affordable Housing Unveiled
- NCAA Explains Different Responses to Ibom Air and Kwam 1 Incidents
- How Nigeria’s Mega Deal with Brazil Will Revolutionize Agriculture and Boost Farmers
- UK Supports Overhaul of Nigerian University Curricula with Focus on Sustainability, Entrepreneurship, and Peace
- PRESIDENT TINUBU DIRECTS EXPEDITED ROLLOUT OF FREE HEALTHCARE FOR LOW-INCOME RETIREES, IMPLEMENTATION OF PENSION INCREASE
- Senate Confirms NCC Board, charged to Consolidate Reforms and Expand Digital space
- Federal Government Unveils Livestock Transformation Programme in Plateau, Promises Thousands of New Job
- Widespread technology outage disrupts flights, banks, media outlets and companies around the world
- Hon. Sunday Dare Speaks on the Emerging Signs of President Tinubu’s Economic Recovery on TVC
- Dangote, Ethiopia Seal $2.5bn Deal to Build One of World’s Largest Fertiliser Plants
- Omokri Slams Obi: ‘No Moral Right to Criticize Tinubu’s Economic Policies’
- Bode George Exposes PDP External Struggles Claims Some Leaders Are Working For APC Against 2027 Polls
- Security Boost: Gov. Abiodun Approves 1,000 New Recruits for Ogun Amotekun
- Tinubu Did Not Appoint Himself Petroleum Minister – Onanuga Fires Back At Critic
- NDDC Raises Alarm Over Fake Scholarship Scams Targeting Nigerians
- If Tinubu succeeds, we will all benefit. If the government fails, we’ll all suffer. I will continue to support Tinubu – Sheikh Sani Jingri
- Tinubu Unveils Bold Child Protection Plan, Demands Tough Crackdown on Child Rights Violators
- Exclusive! Data Breach Alert: Nigerians’ Personal Data Sold Online for N100
- Tinubu Unveils New Vision to Make Africa Trade with Africa
- Tinubu Appoints Climate Crusader Majekodunmi as NCCC Boss, While PETROAN Turns Up Heat on Port Harcourt Refinery
- FCT Unveils Nigeria’s First Solar-Powered Farmers’ Market in Abuja
- Outpouring of Respect in Kano as President Tinubu Mourns Dantata
- Crude Oil Dominates as FAAC Shares N1.82 Trillion for June — AGF
- Oprah Retires, sponsored over 65k people
- Edo Governor Suspends Attorney General, LG Chairman Over Alleged Financial Fraud
- Tinubu Shakes Up NNPC Leadership: Mele Kyari Out, Bayo Ojulari Takes Over
- Pension Win for Low-Income Earners: Withdraw Your Entire Savings Now, Says PENCOM
- “Poisonous Woman” Ohanaeze Appeals For Calm
- Police Arrest Two Kidnap Kingpins, Recover N7.4m, Rifles in Abuja
- Police Nab 23 Criminals in Festive Crackdown on Armed Robbery and Kidnapping
- PLATEAU PDP ELECTS NEW EXCO
- NSC DG Hon. Olopade Lauds FIRS under Zacch Adedeji, Advocates Stronger Partnership Between Taxation and Sports Development
- Benue, Edo, Bayelsa mobilise as Lagdo Dam threat looms
- Electricity Subsidy: Before we open another scam frontier By Taiwo Adisa
- FG to End Rejection of Corps Members by Government Agencies – New policy Unveiled
- Surely, the government must unveil an anti-inflationary policy centred around mass production to address it
- NSC DG, Hon. Bukola Olopade to Hold Talks With Weightlifting Federation of Africa President, Khaled Mehalhel*
- FG Launches N10m Support Scheme for Tertiary Institution Staff
- EFCC Chairman Declares War on Corrupt Local Government Chairmen—No Immunity, No Escape
- MILITARY COURT SENTENCE SOLDIER TO DEATH FOR MURDER.
- PRESS STATEMENT BY THE NORTHERN CHRISTIAN YOUTH PROFESSIONALS ON THE PROPOSED TAX REFORM BILLS
- NNPC, OandO And Atiku Abubakar’s Attack
- DEBUNKING THE “GENOCIDE” FRENZY BY SENATOR TED CRUZ. BILL MAHER. VAN JONES. ET AL
- EFCC Rejects Yahaya Bello’s Grand Entrance: Why Protocol Matters
- African School Games: Fast and Fierce Team Nigerian Sets Pace on Day One of Athletics
- A Visionary Speech: President Tinubu’s Call For Multilateralism And Cooperation In China
- President Tinubu orders 30-day deadline for repair of damaged Nassarawa flyover
- Inside the EFCC’s Biggest Asset Seizure: 753 Abuja Duplexes Forfeited Forever
- PRESIDENT TINUBU: NEW TAX LAWS, THE WAY FORWARD FOR NIGERIA’S PROSPERITY
- Inside Nigeria’s N47.9 Trillion Budget Plan: Bold Revenue Goals, Debt Overhaul, And Security Priorities
- The Impact of Reduced Fuel Prices on Nigerian Economy
- Nigeria on Track to Exit Financial Watchdog List in 2025, Says NFIU
- Ambode Breaks Silence: 9 Powerful Reasons I Was Removed as Lagos Governor
- Tinubu Moves to Reshape INEC:Nominates Five New Electoral Chiefs for Senate Approval
- Nigerian Army Probes Former Brigade Commander Over Corruption Allegations
- Davido Backs Billionaire’s Son Raheem Okoya Amid Song Controversy: ‘Remix Am ASAP’!
- Tinubu Meets Soludo at Aso Rock Amid Political and Development Speculations
- FG Finally Breaks Silence on ‘Lopsided’ Appointments Allegations
- Nigeria Stands Firm: Free HIV Treatment Continues Despite U.S. Funding Cuts
- Investigations : Bash Ali defaming and Peddling Lies Against Former Minister Sunday Dare, National Sports Commission, and Federal Government
- Tinubu: The Driving Force Behind West Africa’s Economic and Political Unity”
- PRESIDENT TINUBU APPOINTS GOVERNING COUNCIL AND PRINCIPAL OFFICERS OF FEDERAL UNIVERSITY IN OGONILAND
- Governor Zulum Faces Allegations of Marginalising Christians in Borno
- K1 De Ultimate Had Alcohol in Flask During Airport Incident – FAAN Confirms
- New Deadly Virus Sparks Global Alarm: Nigeria Quarantines Passengers from China
- TRIBUTE BY HIS EXCELLENCY, PRESIDENT BOLA AHMED TINUBU, GCFR
- Two Kwara Universities Expels 175 Students For Possessing Firearms, Fake Results
- Super Eagles and Nantes Star Moses Simon Recharges Battery in Greece with Wife as New Season Beckons
- Davido Reveals Next Possible Career Move on Wedding Day
- Israel’s Iron Dome “Leaking Missiles”; Experts Question IDF’s Famed Air Defense System
- FG Launches N10 Million interest free loan for tertiary institution workers
- Crisis in Care: Lagos Government Pleads with Doctors to Halt Warning Strike Over Wage Disputes
- Benue’s Political Reset: Governor Alia Dissolves Cabinet in Sweeping Shake-Up
- APC’s New Chairman Yilwatda Declares 2027 Victory: “It’s a Done Deal”
- MKO Abiola: The Champion and Symbol of 25 Years of Uninterrupted Democracy in Nigeria*
- Game-Changer Deal: Dangote Partners With IPMAN For 240 Million Litres Of Fuel Monthly
- Drama In Edo: Governor-elect Okpebholo Accuses Obaseki Of Sabotaging Power Transition
- Alleged $7.2bn Fraud: EFCC Set To Invite Ex-NNPCL Boss Kyari
- Northern Forum Demands Sack of Security Chiefs, Cabinet Shake-Up Over Rising Insecurity
- Mega Market Marvel: Gov. Ododo Unveils Lokoja’s $1B Vision for a Modernized Future
- Akande Calls for Governance and Economic Reform
- TMSG lauds Nigeria’s new status as Africa’s top oil & gas investment hub, attributes it to Tinubu’s policies
- Nationwide Protest In Kaduna : Continues Admist Government Curfew Billions Lost
- Tinubu Returns to Abuja After Sallah Holiday, Infrastructure Launches in Lagos
- NEW DATE FOR THE SPECIAL FEDERAL EXECUTIVE COUNCIL SESSION IN HONOUR OF PRESIDENT MUHAMMADU BUHARI TO BE ANNOUNCED
- Scandal, Seizure, and a New Beginning: How Nok University Became Federal University of Applied Sciences
- Tinubu Confers CFR on Bill Gates, Cites Lifesaving Contributions to Health, Development
- Army Chief Doubles Troops Feeding Allowance, Rolls Out Housing and Loan Schemes
- Outrage as Nigerians Drag NCC to Court Over Controversial 50% Telecom Tariff Hike”
- ⚡ NAF Strike Crushes Bandit Kingpin’s Stronghold in Katsina, 76 Hostages Freed
- Nigeria Ranks 3rd Among World’s Most Indepted Nations: World Bank Report Unveils 2024 Top 10
- Nigeria and Canada Sign Landmark Code-Sharing Deal to Boost Air Travel!
- Dare Salutes “General Overseer of Nigeria’s Democracy” Tinubu at 73
- Kaduna Govt Kicks Off 200,000-Metre Drainage Desilting to Combat Flooding
- Revolution in fuel supply : Dangote Refinery bypasses NNPC to sell petrol directly to Marketers
- Sowore’s Lawyers to X: Ignore DSS ‘Unlawful’ Request to Delete Tinubu Post
- Kano Tops with N1.3bn, Bayelsa Gets Just N358m: How States Shared N22.9bn Ecological Fund in Five Months
- We’re Not a Dumping Ground”: Nigeria Rejects U.S. Push to Accept Venezuelan Deportees Amid BRICS Tensions
- Senate begins public hearings on constitution review
- Wike Launches New Committee To Tackle Building Collapses In Abuja
- Federal Government Endorses Open and Distance Learning to Revolutionize Nigeria’s Education System
- Narrow Escape: Nigerian Striker Victor Boniface Survives Ghastly Car Crash After Match-Winning Heroics
- NIPOST and Lagos State Team Up to Revolutionize E-Commerce in Nigeria
- 2027 Presidency: PDP Courts Jonathan Amid Uncertainty Over Peter Obi’s Return
- Tokyo 2025: Ezekiel Nathaniel Breaks 38–Year Record to Qualify for 400m Hurdles Final, Udodi Onwuzurike Sprints into 200m Semifinal
- Women in Procurement Demand Action: Tinubu Urged to Tackle Public Procurement Corruption
- Ademola Lookman Continues Stellar Form With Two Goals And Two Assists, Strengthens Case For CAF Player Of The Year
- FG Strikes Mega Deal with 9 Energy Giants
- Exclusive Interview With Rarara: Why I Stand By President Tinubu Admist Criticism
- Olatunji Dare at 80: The Man of Letters as a Repairer
- Tinubu’s Eyes on Nigeria’s Future, Not 2027 Election – Presidency
- Tinubu Meets Regional Development Leaders
- FG Empowers 200,000 Nigerians with AI Skills to Drive Digital Economy
- 2027: PDP Loses Ground as Key Members Defect Across North-East
- SGF George Akume to Northern Politicians: Wait for your turn in 2031
- FG Declares 4-Day Easter Holiday
- Ex-CBN Governor Fights to Reclaim 753-Unit Estate Seized by FG
- We’ll resist NASS plan to remove minimum wage from exclusive list – NLC
- Sanwo-Olu Pitches Lagos as the Engine of Nigeria’s $1 Trillion Economy
- PRESIDENT TINUBU ANNOUNCES KEY APPOINTMENTS INTO NUC, NERDC, NEPAD, RENEWS THE APPOINTMENT OF FATIMA SHINKAFI IN SMDF
- The Phantom Menace: Unmasking the Threat of a U.S.-Led Intervention in Nigeria
- Afe Babalola Unleashes Legal Wrath on Dele Farotimi: Accusations of Defamation and Judicial Corruption
- How Much FG, States, and LGs Shared in March 2025
- DG National Sports Commission, Bukola Olopade Secures Rt. Hon. Ochei’s Commitment to Revolutionize Nigerian Sports Development
- we must reflect very deeply, interrogate intensely and look very hard before we leap…. Babatunde Raji Fashola
- Why President Tinubu Always Takes The Hard Road
- Shocking Twist in Nnamdi Kanu’s Trial: Case Reassigned to New Judge!
- NASS Shifts Resumption to May 6: A New Timeline for Legislative Business
- Kekere-Ekun at One: How Nigeria’s Chief Justice is Rebuilding Trust in the Bench
- Dangote to Build New Atlantic Seaport in Ogun as Part of Expansion Drive
- Minimum Wage: NLC, TUC, Organized Labour Convenes Today
- FEC Approves Overhaul of National Urban Development Policy
- I Don’t Feel Nigerian”: UK Tory Leader Kemi Badenoch on Identity and Roots
- Tinubu Signs Tax Reform Bills into Law: What It Means for Nigeria
- Aliko Dangote Steps Down as Chairman of Dangote Cement, Emmanuel Ikazoboh Takes Over with Bold Vision for the Future
- FG Collaborates with China to Digitalize Customs
- TotalEnergies, Garima Petroleum…Dangote refinery announces new fuel distribution partners
- FAAN Suspends Abuja Airport Gate Charges Amid Traffic Woes
- Ibadan: Sunday Dare Commiserates with Fresh FM Over Fire Outbreak
- New Youth Academy to Tackle Unemployment and Skill Deficit in Nigeria
- APC: Presidential Ticket Open to All, Despite Tinubu’s Endorsement
- Ndume: I’ve attended coalition meetings — I may leave APC if Tinubu can’t fix things
- NUGA OFFICIALS EXPRESS SATISFACTION ON FACILITIES FOR UNIJOS 25.
- Sunday Dare is Right — ADC Should Stop Politicising Buhari’s Death
- 7 Days to Go: South Africa, Kenya, Ethiopia, Uganda, Others, Confirm Arrival Dates, as African U18/U20 Athletics Championship Nears*
- NSC mourns the death of Abba Yola – Describes him as a Sports Administrator Per Excellence
- Tinubu Mobilizing All Parts of Nigeria, Not Just Lagos — Sunday Dare Counters Daily Trust Report
- The Antics Of Hakeem Baba Ahmed
- NASS Targets January 31 for Passage of Historic ₦49.7 Trillion 2025 Budget”
- Governor Aiyedatiwa matching order to National Body of Asiwaju-Datiwa 2027
- BREAKING: Outrage in Ibeju-Lekki as Residents Block Roads Over Police Killing of Unarmed Man, Two Others Critical
- Strengthening Regional Cooperation and Institution Building to Address the Evolving Threat of Terrorism in Africa – Bola Tinubu
- 22nd National Sports Festival Medals Table Summary – Day 3
- “I’ve made history “: Chidimma Adetshina Shines as First Runner-up At Miss Universe 2024
- Our Petrol Price Is 15% Cheaper Than NNPCL’s Imported Petrol
- Wike Promises a Better 2025 for FCT Residents Amid Bold Reforms
- We Didn’t Choose This Life: Beggars React To Wike’s Eviction Orders In Abuja
- Tinubu Returns to Nigeria After 19-Day European Visit
- Dangote vs the Oil Unions: Nigeria Braces for Mega Strike Showdown
- Ex-Dunamis Pastor Exposes ‘Staged’ Miracles, Sparks Controversy With Explosive Claims
- President Ruto Bows to Kenyan Youths, Cancels Finance Bill
- Planned Protest:Former Minister Sunday Dare Cautions Nigerians on Violence Protest, Says Nigeria Can Not Erase The Experience of #Endsars. Says Tinubu Reforms On Track.
- CAA salutes Nigeria Government for its bailout to host African Junior Championships in Abeokuta
- Dangote Refinery Guts Fire, Casualty Unknown
- No Excuses! Slash Cement Prices Now” – Umahi Warns Manufacturers
- Tax Reforms and Political Drama: Bauchi Governor Under Fire from Presidential Aide
- Oyo lawmaker, Akinremi dies at 51
- Former Governor Yahaya Bello Honours EFCC’S Invitation
- Dangote Blames Nigeria’s Power Woes on Capital Flight and Stolen Funds Abroad
- Tinubu’s Reforms Fueling a New Wave of Subnational Development.
- How Yoruba Monarchs Secured Afe Babalola’s Forgiveness for Dele Farotimi”
- PRESIDENT TINUBU’S MESSAGE TO THE SUPER FALCONS AHEAD OF THE 2024 WAFCON FINAL IN RABAT
- FG Warns Fish Sellers and Trailer Drivers as Independence Bridge Nears Breaking Point
- Renewed Hope Ward Development Programme to tackle poverty
- NNPCL Strikes Major Gas Deal With Dangote Refinery In Groundbreaking Agreement
- NiMet Forecasts Thunderstorms, Hazy Weather Across Nigeria
- Lagos Power Play: How Akande Panel Forced Meranda Out and Brought Back Obasa
- RMAFC Begins Salary Review for Politicians, Public Office Holders After 18 Years of Stagnation
- NSIA Requests N100bn Monthly Allocation for Economic Growth
- Bobrisky To Face Fresh Criminal Charges As Prison Officers Get Indicted – Activists Speak On Transgender Rights In Nigeria
- FEC Approves Life Insurance Scheme to Secure Families of Deceased Civil Servants
- 18 Months Without Ambassadors, FG Finally Moves to Fill Key Posts
- BREAKING: UAE Set to Ease Visa Hassles for Nigerians
- FG Disowns ASUU Deal, Says No Binding Agreement Signed
- Former Minister Sunday Dare To Attend Annual Inaugural Benjamin Adekunle Memorial Leadership Lecture
- Northern Youth Group Honours UBEC’s Ajibulu with Prestigious Leadership Award
- Validat before amplifying, Tinubu tells Digital influencers.
- The Secret Plot to Block Local Government Autonomy
- CBN Directs Banks to Implement Real-Time Monitoring for Suspicious Transactions
- MTN Nigeria Shifts To Paper-Based SIMs In Push For Sustainability
- Lagos, FG Seal Deal for 68km Rail Line Connecting Lekki, Ajah & VI”
- Imagine Rivers State without a State of Emergency
- FG Reopens Independence Bridge Ahead of Schedule
- Team Nigeria school sports contingents arrive home after impressive outing at inaugural school sports games
- Kebbi State College Of Science And Technology In Chaos: Students Set Provost’s Residence Ablaze Over Alleged Extortion
- Jimmy Carter, Record-Breaking U.S. President, Passes Away at 100
- Tax Turmoil: Northern Governors Clash with Tinubu Over Controversial Reform Bills
- Game-Changer in Nigerian Healthcare: Kogi Governor Transforms Hospital into CUSTECH Teaching Facility
- 50 Years of Waste: How Nigeria Squandered the Wealth of Future Generations
- 2027 in the Balance: Northern Youths Hold Back on Tinubu’s Second Term Endorsement
- 10 Million Jobs in Sight Through AfCFTA Digital Trade
- ABUJA DEVELOPERS ON NOTICE: COMPLETE YOUR DOCUMENTATION OR FACE SANCTIONS!
- NAFDAC Issues Urgent Warning on Fake Cancer Drug in Circulation
- FG to Deploy 7 Million Smart Meters Nationwide to Curb Estimated Billing
- 2 Days to Go: Senegalese Legend Khalilou Fadiga, Music Star Odumodublvck Set for 2025 Barca Legends VS African Legends Clash in Abuja
- PLATEAU ASSEMBLY INTERVENE IN TEXTBOOK PURCHASE, BAN GRADUATION CEREMONIES IN PRY & SECONDARY SCHOOLS.
- 6 Days to Go: Gateway Games 2024 – A Celebration Beyond Sports
- AFTER 18 YEARS IN COURT, FANI-KAYODE WALKS FREE—HERE’S WHY THE JUDGE DISMISSED HIS FORGERY CASE
- Nationwide Crisis Looms: SSANU, NASU Declare Indefinite Strike Over Unpaid Salaries
- 43rd Olubadan coronation holds today
- FG Secures $600 Million to Boost Agriculture, but Farmers Cry Foul Over Selective Support
- NSC DG, Bukola Olopade, Congratulates Chairman Shehu Dikko on NIQS Fellowship Award
- 8 Governors Face Federal Sanctions Over Local Government Autonomy – Full List Revealed
- Mrs. Ajimobi at 65 She is Phenomenal Says Former Minister Dare
- Dangote’s Lifeline: 30,000 Bags of Rice Flood Niger State Amid Rising Hunger”
- Showdown Over Minimum Wage: Workers in Six States and FCT Brace for Strike Despite Government Assurances
- Malaria Vaccine Milestone, Cholera Scourge, and the Exodus of Doctors: Nigeria’s Health Sector in 2024
- KADUNA: FOR PRESIDENT TINUBU, A RESOUNDING POLITICAL VALIDATION
- The Financial Times Misses the Mark Again!
- The Reality of the Nigeria Tinubu is Tackling
- National Assembly faces gridlock as Reps halt consideration of Senate bills
- From Headwinds To Tailwinds – Under President Tinubu, Nigeria Propels Forward*
- NDIC Commences Payment of N46.6bn Liquidation Dividends to Heritage Bank Depositors
- President Tinubu’s Drive Towards a Sustainable Industrialization for Nigeria
- FG Unveils Bold Plan: 500 Hectares Cleared for Ranching, Dairy Boom in Benue
- Enough Is Enough!” – Dino Melaye Drops the PDP Mic
- Nigeria and Australia Team Up to Close Mining Skills Gap and Boost Industry Expertise
- Atiku Demands Annulment as Wike Reclaims Grassroots Control Fubara loses stronghold, APC sweeps 20 councils, PDP takes three • Elders insist Wike’s grip is temporary
- Hunger, poverty now national security threats — NSA, CDS, Defence minister raise alarm
- Nigeria Applauds Finland’s Conviction of Simon Ekpa for Terrorism-Related Crimes
- Dangote Refinery’s Diesel and Jet Fuel Supplies to Disrupt Europe’s Oil Industry, Says OPEC
- Hope Amidst Challenges: Nigerian Leaders Urge Unity and Optimism in Christmas Messages
- Lakurawa Sector Expand: FG Send More Troops As Terrorists Spread Across North
- Ali Dalori replaces Ganduje as acting national chairman of APC
- Nigeria, Saint Lucia to establish diplomatic relations
- Heroes in the Skies: How Nigerian Air Force Troops Are Winning the Battle Against Insecurity
- Ondo Declares Friday Work-Free as LG Polls Take Center Stage
- PRESIDENT TINUBU APPOINTS LOUIS ODION, UMMUSALMA RABIU EXECUTIVE COMMISSIONERS OF FCCPC
- Natasha Akpoti-Uduaghan Slapped with 6-Month Suspension!”
- DISENGAGEMENT OF FEGHO JOHN UMUNUBO
- Lagos Is Not for Boys Joe Igbokwe Slammed Over Controversial Comment Against Seyi Tinubu’s Guber Ambition
- Afe Babalola vs. Dele Farotimi: Afenifere Urges Calm, Asks Nigerians to Let Courts Decide Amid Planned Protests
- Southwest Caucus of the House of Representatives Announces Passage of Bill to Establish the South West Development Commission
- How Tinubu’s New Securities Act is Reshaping Nigeria’s Investment Landscape
- Starting June 15, Your ATM Card Won’t Work Like Before – Here’s What Every South African Needs to Know
- Drama in the Lagos Assembly: Obasa Fights Back After Ouster, Tensions Escalate
- Gateway Games 2024: Redefining the Spirit and Standards of the National Sports Festival and Nigerian Sports
- FG Partners Julius Berger to Fix Alarming Structural Defects on Lagos’ Iconic Third Mainland Bridge
- FG Pushes for Local Drug and Vaccine Production to End Medicine Shortages in Nigeria
- $2bn Energy Fund Probe: Reps Demand Ministers Face House Over Worsening Power Crisis
- WHY LAGOS. YES LAGOS. (AND ABUJA TOO). THE NORTH IS MOBILIZED. NOT MARGINALIZED.
- Presidency applauds Dangote Refinery’s fuel distribution plan, says it’s major boost to CNG initiative
- FG launches technical training program, calls for accreditation of vocational centres nationwide
- NMA Halts Planned Strike, Issues Fresh 21-Day Ultimatum Over Allowance Dispute
- INEC Gears Up for 2027 Elections
- President Tinubu Receives over 64,000 Jigawa Defectors into APC
- Ondo LG Polls: APC Dominates with Wins in 16 LGAs, Results in 2 Councils Awaited
- Shettima Jets to Davos: What Nigeria Stands to Gain from the 2025 World Economic Forum
- Reno Omokri Slams Peter Obi Over Death Threat Claims, APC Fires Back
- Sadiq Umar, Bello El-Rufai Secure Ownership Rights of Rancher Bees FC
- Philip Shuaibu Praises DG NSC Bukola Olopade’s Transformative Impact on Nigerian Sports
- Bola Tinubu won the election. Period. Tinubu adviser, Sunday Dare takes Babachir Lawal to the cleaners.
- Nigerian Naira Worst 2024 Performing Currency
- 2025 AfroBasket: Nigeria’s D’Tigers Face Indomitable Lions of Cameroon in Battle of the Beasts Showdown
- Nationwide Food Price Drop — A Testament to President Bola Ahmed Tinubu’s Economic Impact
- Dirty Fuel Scandal? Oil Marketers Clap Back At Dangote’s Accusations
- Nigerian Journalist Adejuwon Soyinka Released On Bail After 6-Hour Detention By SSS
- Benue Drama: Gov Alia Washes Hands Off Failed Plot to Sack Speaker as 4 Lawmakers Face Suspension
- Nigeria -Benin World Cup React! *I DON’T WATCH NIGERIA FOOTBALL MATCHES AGAIN – _FORMER SUPER EAGLES COACH ADEGBOYEGA ONIGBINDE
- Seyi Tinubu’s Humanitarian Efforts: Why He Deserves Medals, Not Criticism
- Minister of Humanitarian Affairs and Poverty Reduction, Prof Nentawe Yilwatda, visits Plateau Communities.
- N50 Million Bail Drama: Dele Farotimi’s Cybercrime Case Takes a New Twist
- Crude Oil Losses Drop To 16-Year-Low As NUPRC Releases Latest Report
- Strike Suspended: Universities Set To Reopen As NASU, SSANU Call Off Protest Over Withheld Salaries
- Christmas Cheer: Ogun Workers Praise Governor Abiodun’s Compassionate Bonus Approval
- Game-Changer for Nigeria’s Energy Future: Adedeji Unveils Ambitious 2025 CNG Initiative
- TINUBU DECLARES 9TH NATIONAL YOUTH GAMES OPEN IN ASABA, PLEDGES STRONGER SPORTS DEVELOPMENT*
- FG eliminates VAT on food, education, healthcare, reveals start date
- FAAC JULY MEETING
- 2027 elections: Atiku, Obi, Mark launch ADC to unseat Tinubu
- TRIBUTE TO LATE PRESIDENT MUHAMMADU BUHARI
- PRESIDENT TINUBU’S RENEWED HOPE HOUSING AGENDA TAKES SHAPE UNDER THE MINISTRY OF HOUSING AND URBAN DEVELOPMENT
- Asaba 2025: Medals Hustle Heats Up, as Lagos, Edo, Jostle for Top Spot at National Youth Games
- Mr. Sunday Dare on Professor Wole Soyinka at 90
- Ex-Kogi Governor Yahaya Bello Secures N500M Bail, Banned from Foreign Travel
- NMA Raises Red Flag Over Brain Drain, Blasts New Wage Circular as Punishment for Loyalty
- PCN President Sunday Odebode commends NSC for improved funding of Nigeria Para-Sports
- “Illegal Admissions: Jamb Accuses Nigerian Universities”
- EXPOSED: JAMB Flags Over 9,400 Illegal Admissions Across 20 Nigerian Institutions
- President Tinubu Reaffirms Strong Support For SGF George Akume
- Nnamdi Kanu’s Wife Finally Speaks on His Court Apology
- Dr Okonjo Et tal – On President Tinubu Staying the Course – Sunday Dare
- 2027: “If You Want to Bury PDP, Bring Back Obi” – Wike Fires Warning Shot
- Nigeria, A Country Governed By Law, Categorically Denies Any Human Rights Abuse
- Tinubu Urges Senate to Approve Oludare as New NDIC Boss
- Birthday: Mr. Sunday Dare Felicitates With FIRS Chairman, Dr Zacch Adelabu.
- Nigeria Just Made $6.83 Billion in One Year
- Nigeria U19 Cricket Team Receives $5,000 Boost from National Sports Commission Ahead of England Clash at ICC World Cup
- NIGERIAN EXPERT, BULAMA BUKARTI , DISMISSES TRUMP’S CHRISTIAN GENOCIDE CLAIM
- CME/HM Finance, CBN Governor, and FIRS Chairman Meet to Strengthen Monetary–Fiscal Coordination
- Tinubu’s Crackdown: Atiku Warns—’We May All End Up in Jail
- Labour Unions in Kano Call for Reversal of Power and Water Sector Privatisation
- Understanding Nigeria’s Forex Moves: Supporting the Naira, Not Defending It
- CBN Reports Shocking N16 Trillion Drop in Domestic Lending”
- Tinubu departs Saint Lucia for Brazil
- Freedom After 10 Months: Saudi Arabia Releases 3 Nigerian Women Accused of Cocaine Trafficking
- PRESIDENT TINUBU RECEIVES REMAINS OF FORMER PRESIDENT BUHARI IN KATSINA AHEAD OF FINAL RITES IN DAURA
- Lawan Declares Full Support for Tinubu
- Ill-Informed and Sub-Commercial”: NNPCL Slams Early Port Harcourt Refinery Restart, Sparks National Debate
- AGAIN, GOV AIYEDATIWA CLEARS N2.4B GRATUITY BACKLOG FOR 2016, 2017 RETIREES
- FG Cuts Abuja Transport Fares by 40% to Ease Commuter Burden
- Lavish Spending and Mounting Debt: How 29 Nigerian States Burnt N2 Trillion on Travels and Perks in 2024
- Tinubu Fast-Tracks Pension Reforms, Mandates Immediate Boost for Retirees
- Nigeria Needs Her Youth to Advance
- NNPC Medical Staff Demand Justice After Colleague’s Death in Port Harcourt Amid Alleged Negligence and Decades of Exploitation
- Tax Tensions: Northern Senators Clash as Stakeholders Scramble to Save Controversial Reform Bills
- Power Struggle: Inside The PDP’s Fractured Leadership And Rising 2027 Ambitions
- ARCON to Investigate 9mobile Over Alleged ₦1 Billion Advertising Debt
- Embrace CNG, Former Minister Sunday Dare Advises Nigerians.
- 2027: Jonathan, Obi, Makinde Set for PDP Showdown as Party Zoning Tilts to the South
- 2027 Begins Now: INEC Rolls Out Nationwide Voter Registration from August 18
- IMF’s Bold Advice To Nigeria: How To Fix Economic Reforms And Win Public Trust
- Nigeria sets up a repeat of 2021 Afrobasket final as D’Tigress remains on course for 5th straight Title
- Shock in Minna: Ex-Niger State Official Brutally Stabbed by Teen Car Painter Over Conspiracy Plot
- NAFDAC Issues Public Alert, Recalls Batch of Juhel Folic Acid Tablets Over Quality Concerns
- Coalition members move to exit old parties
- Enugu State Government announces members of LOC for 2026 National Sports Festival
- NSC Celebrates Ajayi Kayinsola on His 21st Birthday and Historic World Championships Feat
- BROADCAST BY HIS EXCELLENCY BOLA AHMED TINUBU, PRESIDENT AND COMMANDER-IN-CHIEF OF THE ARMED FORCES OF THE FEDERAL REPUBLIC OF NIGERIA ON THE NATIONWIDE PROTEST
- Atiku, Governors, and Leaders Applaud Azuta-Mbata’s Ohanaeze Presidency
- FG Partners with Chinese Auto Giant BAIC to Pioneer Battery Swap Tech for Nigeria’s Clean Energy Drive
- Petroleum Minister Hosts Crucial Meeting To Resolve Dangote Refinery Crisis
- Historic Milestone: Access Bank Becomes Nigeria’s First Bank to Surpass CBN’s N500bn Capital Threshold
- Tinubu Reaffirms His Administration’s Commitment to National Security
- In Nigeria you can get booked for a naming ceremony
- CHINA OPPOSES TRUMP ON NIGERIA. SAYS NIGERIA A STRATEGIC PARTNER. – Mao Ning
- Game Changer: Local Governments to Receive Direct Allocations Starting Next Month
- Nigeria Teams Up with U.S. Firm to Empower Youth with Digital Skills for Global Success
- All Nigerian Affair As Boniface Scores, Agu Nets Own Goal, Njimah Grabs Assist In Leverkusen’s Four-Goal Thriller Against Bremen
- Federal Government Announces DICON’s Expansion Into International Arms Trade
- Amusan, Brume lead Nigerian Tthletes to Douala Ahead of Paris 2024 Olympics
- Ademola Lookman’s Brace Sinks Conte’s Napoli, Tops Chart As Serie A’s Best Attacker In 2024
- Vice President Shettima Unveils $115 Million Operational Terminal At Onne Seaport, Boosting Nigeria’s Maritime Sector.
- How a 69-Year-Old Nigerian Man Became the First Ever Recipient of a Living-Donor Kidney Transplant at FMC Abuja
- Judge Slams Bash Ali for Wasting Court’s Time, Dismisses ₦500bn Extortion/ defamation Suit Against Sunday Dare
- Meet the 16-Year-Old Genius Who Scored 334 in UTME—While 75% of Students Struggled to Cross 200
- FG Set to Auction 753 Luxury Duplexes Seized from Ex-CBN Governor Emefiele
- Before ‘Democracy,’ After ‘Democracy’
- Tech Revolution Hits the North-West NIGCOMSAT Unveils Space-Tech Hackathon & VSAT Training for Youths
- A Highway To Injustice? Lafiaji Residents Cry Out Against Lagos-Calabar Coastal Highway Project
- Russia Tests Internet Blackout: VPNs Fail as Sovereign Web Takes Hold
- 11 Chinese Nationals Arraigned in Lagos for Crypto Fraud and Romance Scams
- Reviving Democracy from the Ground Up: Tinubu’s Bold Push for Local Government Autonomy
- Tinubu Calls for Global Unity at Abu Dhabi Sustainability Summit
- Olorunnimbe Vows to Deepen Broadband, Protect Consumers as NCC Chairman
- Lagos Govt Set to Reinstate Monthly Environmental Sanitation Exercise
- Senate investigates ICPC’s compliance with federal character
- Unnecessary Distractions: Shehu Sani Defends Matawalle, Ribadu Amid Banditry Criticism
- Exclusive in New Tell All Book Adoke Indicts Buhari Foreign NGOS Malabu Saga
- Food Inflation: NSA, 36 States launch joint action.
- Mc Oluomo Crowned As NURTW National President In Grand Abuja Ceremony
- Nigerians Plunge Into Darkness Again: National Grid Collapses For The 10th Time In 2024
- Team Nigeria Dazzles in an Electrifying Day 2 at CAA U18/U20 Athletics Championship
- Labour Party’s 2027 Game Plan: Inside the Grassroots Revolution to Rebuild and Dominate
- We must preserve our democracy – President Tinubu
- 2027: Olawepo-Hashim Declares War on PDP Zoning Policy, Vows to Fight at National Convention
- Ghana’s Parliament Salutes Black Queens with ₵100,000 Gift After WAFCON Heroics
- FG Promises Bold Action as U.S. Hits Nigerian Exports with 14% Hike
- 20 Days to Go: Countdown Continues as Access Bank Lagos City Marathon Nears
- Tinubu’s Mining Reforms Attract $800 Million in Foreign Investments – Alake
- Dangote Refinery acquires fresh 5m barrels of crude oil from US
- Renewed Hope GVTHC Applauds Dr. Abdullahi on Groundbreaking Initiative for the Establishment of Renewable Energy College in Nigeria
- Tambuwal Regains Freedom, Vows to Cooperate Fully with EFCC Probe
- Nigeria, Brazil Sign Five MoUs as Tinubu Welcomes Petrobras’ Return
- NSC DG Bukola Olopade reaffirms the commitment of the Commission to Training and Retraining of Staff for Scientific Productivity*
- President Tinubu’s Legacy: Records, Not Rumors
- Kebbi Under Siege—Governor Begs FG for Military Base to Tackle Deadly Bandits
- Nigeria Hits Refining Milestone: Port Harcourt Refinery Resumes, Boosting Fuel Production To 860,000 BPD
- FG rewards 18 civil servants with cars, laptops
- Tinubu Signs North-Central Development Commission Bill Into Law
- The Making of Confidence Vote In President Tinubu
- LPG Showdown: Marketers Cry Foul as Dangote Moves to Slash Cooking Gas Prices
- High Court Judge, Wife, Driver Abducted in Borno
- FG Plans to Transform Nigeria’s Economy and Healthcare
- Tinubu Overrides Panel, Keeps Obasa as Speaker Despite Controversy
- Major Shake-Up in Police Leadership: PSC Appoints New DIGs, Commissioners
- Game Changer : Dangote Refinery Deal Promises Cheaper Fuel Prices For Nigerians
- NSC to Host Capacity-Building Workshop for Sports Officers and Professionals
- New Vision, New Era: BPP DG Pledges Radical Overhaul of Procurement Practices
- Breaking News: Tambuwal detained at the EFCC
- Tinubu Appoints New Vice Chancellors for Education Universities in Zaria, Kano
- 2027 Showdown: Wike-Makinde Rift Threatens PDP’s High-Stakes Ibadan Convention
- PRESIDENT TINUBU, NIGERIA AND SHAPING THE BRICKS DIPLOMACY.
- Refiners Association Urges NNPCL To Sell Port Harcourt Refinery, Others To Fund Modular Plants
- President Tinubu extends the tenure of the Comptroller-General of Customs
- FG, Borno Join Forces to Transform Azare Orthopaedic Hospital into World-Class Medical Hub
- CREDIT ALERTS FOR 36 STATES and FCT:
- Shettima Lauds Nigeria-Brazil $1bn Agric Deal
- How Top Government Agencies Are Secretly Violating Federal Character Rules
- Cholera Outbreak Claims 13 Lives in Niger State as Government Opens Emergency Isolation Centres
- *Renowned Sports Management Professional Damilola Pedro Appointed COO of Esports Federation*
- OGBOMOSO AND THE GARRULOUS AND VITRIOLIC IMAM – THE NEED TO TAKE ACTION NOW!
- Southwest Stakeholders Dialogue Holds in Akure
- EU Commits €10.4 Million to Power Nigeria’s Health Centres with Solar Energy
- Pope Francis Dies at 88: A Legacy of Reform and Compassion”
- Senator Ifeanyi Ubah Passes Away In London
- History Will Judge Us by the Bridges We Build, Not the Battles We Fight’”
- PRESIDENT TINUBU DIRECTS THAT ONLY AUTHORIZED OFFICIALS WITH BUSINESS AT UNGA SHOULD ATTEND
- BREAKING: Ex-Buhari’s minister, Audu Ogbeh is dead
- Stop the blame Game-former Minister urges young and old
- Nigeria’s Top Female Singers:What sets them apart.
- No Passport? Nigerians Can Now Apply for South African Visas Under New Bilateral Agreement
- After Buhari: APC Faces a New Era of Uncertainty Ahead of 2027
- Tinubu’s traducers and Benue’s visit
- REBASED GDP: SEPARATING FACTS FROM FICTION
- Passport Drama: Court Tells Yahaya Bello — “Your Passport Is Not With Us
- Domestic Air Travellers Decry Soaring Ticket Prices Ahead of Christmas
- Enugu State Gears Up for 23rd National Sports Festival, as NSC DG, Hon. Bukola Olopade Holds Productive Meeting with Governor Peter Mbah
- China’s Foreign Minister Visits Nigeria: A Game-Changer for Africa’s Economic Future
- Oil mafias stronger than drug mafias – Dangote
- Tinubu Approves N2 Billion for Resettling Flood Victims in Niger State
- FG Unveils Mega Boost for Small Businesses: Access Up to N5 Million at 9% Interest!
- FG New Federal Medical Centre to Turn North-East into Nigeria’s Healthcare hub
- 2027: Politicians Plotting Jonathan’s Return to Power – Bashir Ahmad Raises Concern
- Let the Games Begin: Opening Ceremony for 22nd National Sports Festival Holds Sunday in Abeokuta
- PLATEAU COMMISSIONS NEW MARKET TO BOOST ECONOMY. Yemi Kosoko, Jos.
- Tinubu Reforms will save Nigerians not policy Flip-flops
- Nigeria’s Debt Hits N138tn: National Assembly Faces Fierce Backlash For Rubber-Stamping Loan Approvals
- Chief Dele Momodu Urges Nigerian Youths To Choose Dialogue Over Protest
- Eguavoen’s Fourth Coming: Can Nigeria AvengeJune’s Loss To Benin?
- Military Declares War on IPOB: Vows to Crush Sit-at-Home Orders in Southeast!
- Sunday Dare Calls for Legal Overhaul, Commends Tinubu’s Reforms to Strengthen Rule of Law
- *Badminton Federation of Nigeria Appoints Sports Management Expert, Blessing Ekwe Chisala as COO*
- Tinubu Reshuffles Federal Character Commission, Confirms Dankaka and Musa in Top Roles
- POSTSCRIPT OWERRI : IN THE HEARTLAND OF THE SOUTH EAST, PRESIDENT TINUBU STRENGTHENS BONDS, REASSURES A NATION.
- PRESS STATEMENT NSC DG, Hon. Bukola Olopade, Urges Nigerian Para Badminton Team to Excel in Spain
- How Facility Management Can Boost Nigeria’s Economic Stability – AFMPN President
- Kabiru Masari, Beacon of Integrity, Loyalty in Nigerian Politics
- Oil Production: FG to withdraw licence of firms with dormant oil fields
- 5 Days to Go : Enugu State Government promises World Class experience at Enugu City International Marathon
- 20 Nigerian Words Make History in Oxford English Dictionary
- Tragedy in South Africa: NiDCOM Demands Justice for Slain Nigerians
- BREAKING: Federal Government Declares Extra Public Holidays for Christmas and New Year – Here’s What You Need to Know
- Rivers State Boils as Lawmakers Move to Oust Governor Fubara
- 15 Days to Go: Intrigues, Suspense, Culminates in the Excitement for 10th Access Bank Lagos City Marathon
- PRESIDENT TINUBU KNOWS OPPOSITION COALITIONISTS TOO WELL, UNBOTHERED BY THEIR ANTICS
- FAAC Disburses N1.681 Trillion April 2025 Revenue to FG, States, and LGs
- New Ministry of Livestock Development Announced by Tinubu
- BREAKING: Tinubu Orders National Flags at Half-Staff for 7 Days in Honour of Late President Muhammadu Buhari
- Ibadan Funfair Tragedy: 35 Dead, Ooni’s Ex-Queen Detained as Tinubu Orders Probe
- Dare: Tax Reforms, Tinubu Determined To Promote Prosperity By Protecting The Vulnerable
- NAWIS commends NSC’s supervisory role as Fatima Yusuf-Olukoju wins Elections into AFN Board as Nawis Rep*
- Osinbajo Subtle Warning To Tinubu: Urgent Action Needed On Nigeria’s Economic Hardship
- Tinubu Unveils State-of-the-Art Barracks, Vows Unwavering Support for Troops
- NASS Stop wasting money on constitutional amendment, rather create a new constitution- Tunji Abayomi
- Lagos Government Condemns Viral Tweet Calling For Igbo Exodus, Demands Probe And Prosecution
- Nigeria Partners with UNICEF to Train 20 Million Youth in Digital Skills by 2030
- BREAKING: Aminu Dantata passes away at 94
- NSC DG Hon. Bukola Olopade Receives Ex-Super Eagles Star Obafemi Martins, Urges Young Players to Emulate His Patriotism
- Asaba 2025: Medals Hustle Heats Up, as Lagos, Edo, Jostle for Top Spot at National Youth Games
- President Tinubu Welcomes Positive GDP Growth Report
- Tragedy Strikes: Former Konga CEO Nick Imudia’s Shocking Suicide
- Horror in Anambra: 74-Year-Old Woman in Wheelchair Burned Alive – Four Arrested, Boyfriend at Large”
- Wike in the Spotlight: Is the FCT Minister Truly Working for APC
- MU YI HATTARA DA TCHIANI
- Nigeria Seals $175 Million Deal With UNIDO to Supercharge Industrial Growth
- Team Nigeria Gets Set to Depart for World Para-Powerlifting Championships in Santiago, Chile
- Tinubu Hails Historic Papal Election, Welcomes Pope Leo XIV as Beacon of Hope and Humanity
- Academy Trains Doctors, Other Professionals in Clinical and Business Intelligence
- N388M Jackpot! FCT Minister Empowers 10 Communities with Life-Changing Funds and Tools
- Nilayo Sports Management company announces Valuejet as official Aviation partner for 10th Anniversary of Access Bank Lagos City Marathon *
- President Tinubu splits the Nigerian College Of Aviation, Zaria, Kaduna State into 6 campuses with 1 in each geopolitical zone of Nigeria
- SERAP’s Ultimatum: Reverse Telecom Tariff Hike or Face Legal Battle, Tinubu Govt Warned
- Arewa Youth Assembly Backs SGF, Rejects Baseless Allegations
- The Imperative of Emergency Rule in Rivers
- Tinubu Races Against Time to Unveil Lagos-Calabar Coastal Highway Before May 25—Umahi Drops Big Reveal
- Tinubu Mourns with Governor Ododo Over Father’s Passing at 83
- 2030 Commonwealth Games: Nigerian Delegation Arrives United Kingdom for Final Phase Bid Presentation
- Fuel Prices Now Beyond FG’s Control: Minister Reveals Market-Driven Dynamics
- Federal Government Inaugurates Presidential Committee to Accelerate Nigeria’s Digital Infrastructure
- FG Declares May 1 Public Holiday
- FG Launch Groundbreaking Digital Ethics Hub That Will Revolutionize Health Research in Nigeria
- CBN Draws the Line: PoS Terminals Must Be Geo-Tagged or Go Dark in 60 Days
- U.S. Official Applauds EFCC’s Anti-Corruption Crusade as ‘Impressive and Far-Reaching
- Full-Time HND Graduates in Nigeria Can Now Join NYSC
- TINUBU DECLARES 9TH NATIONAL YOUTH GAMES OPEN IN ASABA, PLEDGES STRONGER SPORTS DEVELOPMENT
- 2027: PDP’s Zoning Tactics a Bait for Obi, Jonathan, Amaechi – ADC
- NAF Unleashes Devastating Airstrikes on Terrorists in Borno, Wipes Out Hideouts
- Obasanjo’s Bitterness Over Tinubu’s Success : Presidency Fires Back
- APC THANKS THE GOOD PEOPLE OF RIVERS STATE FOR LGA ELECTION VICTORIES … DISMISSES ATIKU’S BASELESS ALLEGATIONS
- Like Former US President Reagan, Tinubu Will Prove Doubters Wrong, His Policies Will Yield Great Dividends
- No Fireworks This Festive Season: Police Ban Firecrackers in Abuja Ahead of Christmas
- Tinubu’s Bold Reforms Or Atiku’s Missed Opportunity? Presidency Hits Back Amid Economic Debate
- Crackdown on Birth Tourism: U.S. Warns Nigerians Against Visa Misuse for Childbirth Citizenship
- Punch Editorial Misses The Mark: A Balanced Perspective On Tinubu’s Agenda
- World Bank Warns Nigeria, Others as Investors Shun Debt-ridden Economies
- Nigeria’s Economy Now Showing Resilience And Adaptability
- NSC DG Lauds Gov. Abiodun, BetKing on Hosting Wheelchair National Basketball Championship*
- France Backs Nigeria’s Mining Revolution with Major Investment Pledge
- PRESIDENT TINUBU ARRIVES IN BRAZIL TO BEGIN STATE VISIT
- BREAKING: Gov. Alia Dismisses Cabinet, Names Barr. Moses Atagher as Chief of Staff in Major Shake-Up
- From Ideas to Income: Senator Katung Equips 500 Youth and Women Entrepreneurs in Southern Kaduna
- Oil Revenue Rift:APC And PDP Governors Clash Over Federation Fund
- PLATEAU JOINT TASK FORCE APPREHENDS WEAPON FABRICATOR. BY Yemi Kosoko
- IG’s Tenure Sparks Controversy as PSC Retires Senior Police Officers
- FG 77,400 New Houses Coming — Here’s Who Qualifies”
- FEC approves $45.3 million for rail link connecting four western ports to the hinterlands
- President Tinubu Congratulates Dr. Zainab Shinkafi-Bagudu On Her Election As President Of UICC
- Troops Repel Boko Haram Ambush in Borno, Kill 13 Terrorists
- Open-Ended Judgments and the Erosion of Judicial Credibility in Nigeria
- NCC Unveils New Cybersecurity Strategy to Safeguard Nigeria’s Telecom Sector
- PRESIDENT TINUBU LAUDS PETROBRAS’ IMMINENT RETURN TO NIGERIA AS NIGERIA, BRAZIL SIGN FIVE MOUs TO BOOST ECONOMIC TIES
- Sunday Dare’s compelling appearance on TVC’s Breakfast Show to address recent claims about Nigeria’s food importation and the administration’s efforts to boost food security
- Legal Uproar: NBA Blasts Police Over Lawyer Dele Farotimi’s Arrest and Office Invasion
- NAFDAC clarifies sachet alcohol ban, says temporary lifting ends December 31
- Tragic Boxing Day Crash on Lagos-Ibadan Expressway: 2 Dead, 15 Injured in Bus Accident
- Good News for Drivers: Fuel Prices Hit New Lows in January 2025″
- $18 Billion Down the Drain”: Dangote Doubts NNPC Refineries Will Ever Work Again
- Nigeria, Brazil Ministers Push for Deeper South–South Economic Ties in Brasília
- FIRS Empowers Southwest Youths to Revolutionize Livestock Farming and Combat Poverty”
- Kwakwanso Cautions Against Protest!
- NNPC Boss Hints at Possible Sale of Refineries Amid Rising Challenges Ojulari says review underway, revamp plans growing tougher by the day
- ECOWAS Working Towards Return of Mali, Burkina Faso, Niger — Tuggar
- President Bola Tinubu’s Commitment and Leadership Will Transform Nigerian Sports Sector” – Sunday Dare*
- Shock Omission:Asisat Oshoala Dropped From Super Falcons Squad Under New Coach
- 2025 Para Powerlifting Championship: Folashade Oluwafemiayo Sets New African and World Record in 86kg Double Gold Swoop
- South East Reforms: Chibuike Jonas Lauds Tinubu’s SEDC Shake-Up, Hails Ben Kalu’s Leadership
- President Tinubu Has Not Marginalized Other Ethnic Groups To Favour Yorubas
- Shocking Exit: Elon Musk’s Transgender Daughter Plans To Leave US After Trump’s victory
- FIJ Journalist Brutally Assaulted, Threatened With Beheading by Lagos Police Over Extortion Probe
- Soludo Sacks Vigilante Operatives Over Brutal Assault on Corps Member
- Ex-Kogi Gov Yahaya Bello’s Bail Drama: Court Denies Release Amid Explosive N110B Fraud Charges
- NAF Airstrikes Eliminate Key ISWAP Commanders in Southern Borno
- Facebook Ban Won’t Silence My Support For Tinubu, Says Rarara
- A Time for Unity”: Ganduje Bows Out, Endorses Yilwatda as APC’s New National Chairman Abuja
- Where is The Money? Despite N2.67 Trillion Allocation, Poverty And Decay Persist In Nigeria’s Local Governments
- Wike Reveals President’s Plans to Visit Rural Communities for Project Commissioning
- Tinubu’s Cabinet Approves Game-Changer Bill to Revive Nigeria’s Cocoa Industry
- How a Nigerian Scammer Nearly Got Away With $860K in a Shocking U.S. Crypto Bust
- WAFCON: GOV AIYEDATIWA GIFTS SUPER FALCONS PLAYER, TOSIN DEMEHIN, N30M CASH, HOUSE; GIFTS N15M EACH TO TWO CREW MEMBERS
- SGF, Political Boldness and the Northern Anger
- MOVING NIGERIA FROM CONSUMPTION TO PRODUCTION – SUNDAY DARE
- Segun Gbayi: From Champion Judoka to Judo’s Guiding Light in Nigeria
- AfDB Unveils Bold Strategy to Boost Nigeria’s Agriculture and Infrastructure—Here’s What You Need to Know
- 2027 Presidential Rumors: Atiku and Obi Deny Joint Bid After Viral Breakfast Reunion
- FCT-IRS Targets 10,000 Millionaires in Bold Tax Compliance Crackdown
- 5 Days to Go! Osimhen Leads 5 Super Eagles Stars, Others to Abuja for Charity Champions Cup*
- Trump Shocks The World: Elon Musk And Vivek Ramaswamy Tapped To Lead Government Efficiency Overhaul
- From Scrap to Sky: How NAF Engineers Brought a 23-Year-Grounded Aircraft Back to Life
- Nation Bids Farewell to a Patriot: Tributes Pour in for Lt. Gen. Jeremiah Useni
- Education Minister Proposes 12-Year Basic Education System
- Akpabio Fights Back Against Sexual Harassment Allegations
- Edo State Governorship Election: A Glimpse Into The Future
- FG Begins Move to Bring Home 15,000 Nigerians Stranded in Cameroon, Niger, and Chad
- Dr. Doyin Abiola, Pioneering Journalist and Wife of MKO Abiola, Passes Away
- Tinubu at 72: You Have Proven To Be A Remarkable Leader – Immediate Past Minister, Chief Sunday Dare Felicitates With President Bola Tinubu.
- Tinubu’s Ramadan Surprise: 7,000 Bags of Rice Gifted to APC Members in Zamfara
- NAFDAC Shuts Down Abuja Supermarket Over Chinese-Labeled Goods and Expired Products—What You Need to Know
- Adams Oshiomhole’s Son Lands Key Political Role In Edo State: see His Surprising New Appointment
- Supreme Court and Top Institutions Flagged in Alarming ICPC Corruption Risk Report
- Lagos Urges Doctors’ Guild to Rethink Warning Strike as Talks Continue
- Nigerian Police Chief Egbetokun Stops Retirement Of Simon Lough, Igweh, Other Officers Implicated In Forgery, Falsification, Bypassing Service Regulations
- Tinubu Calls on Qatar to Back Nigeria’s Anti-Poverty Efforts, Invites Investment in Agriculture and More
- Necessity of Intervention in Rivers and the burden of leadership in times of crisis
- Edo Decides 2024: Collation Of Results
- New NNPC Chairman Eng Musa Kida holds Strategic meeting with NSC for sustainable Sports Growth
- Petroleum Tanker Drivers Union Denies Plans To Join August 1 Protest
- PDP at the Crossroads: Wike, Makinde, and the Battle for Nigeria’s Main Opposition
- RIVERS EMERGENCY DECLARATION : PRESIDENT TINUBU UPHELD THE NIGERIAN CONSTITUTION. ACTED IN OVERIDING NATIONAL INTEREST.
- Tears, Tribute And Honour: Nation Bids Emotional Farewell To General Lagbaja
- The Election That Could Change Everything: What You Need To Know About US Presidential Vote
- Rivers Emergency rule Vs Borno, Yobe, Adamawa in 2013
- Justice Dodo Dies at 70, Tinubu Mourns
- Migrant Battalion: How African Governments Enable Russia’s Recruitment of Young Women for Its Drone War
- Isah Mohammed’s Debut Goal not Enough to Rescue Away Points for Enyimba
- Tinubu Stuns Nigerians: 774 Young Health Fellows Land Federal Jobs in Groundbreaking Move!”
- Inside the $600M Oil Debt Drama: How Aluko, Diezani, Obaigbena, and Others Rocked First Bank
- The Administration of President Bola Tinubu Opens Portal for N10million staff support for academic and non- academic staff of Tertiary institutions.
- EFCC Sets The Record Straight: Technical Glitch, Not Hacking Incident.
- TINUBU’S TAX REFORMS SET TO SPUR BUSINESS GROWTH AND INVESTMENT
- Timetable Released for CAA 3rd African U18/U20 Athletics Championship
- Where’s the Cash? 94% of Nigeria’s Currency Circulates Outside Banks, Says CBN
- Super Eagles Winger Moses Simon Continues Philanthropic Efforts with Donation to Benue State FA
- At Inauguration of Ikeja Disco’s 15MVA Substation, Adesina Says FG Restoring Confidence in Power Sector
- FIRS Rolls Out New Nationwide SOP to Standardize Tax Services and Eliminate Confusion
- ASUU Storms Campuses Nationwide, Warns of Imminent Strike Over Govt’s ‘Wicked Neglect’ of Universities
- End of an Era: Nigeria’s Former President Muhammadu Buhari Passes Away in London
- Drama Alert: Veekee James And Husband shake The Internet With Explosive ‘Suspect Challenge’
- Benue APC : The Alarming Crisis Sponsored by Governor Alia Threatens APC’s Future in Benue state*
- FG to Crack Down on Illegal Migrants and Companies Ignoring Immigration Laws
- Finnish Court Sets Trial Date for Pro-Biafra Agitator Simon Ekpa in May 2025
- National Sports Commission in capable Hands- Aluko
- Court Stops FRSC from Seizing Vehicles Over Faded Number Plates
- Show Us the Money: NASS Summons Ministers Over Nigeria’s Economic Diversification Promises
- Governors Establish Committees To Implement N70,000 Minimum Wage
- NLC Threatens Nationwide Protest Over FG’s Plan to Hike Electricity Tariffs
- Nigerian Government Launches N2 Million Interest-Free Consumer Credit Scheme
- From N8.9 Billion to N1.5 Trillion? Senator Akpoti’s Bold Call to Revamp Nigeria’s Information Ministry Budget
- Wike VS Fubara: INEC Finally Speaks On Rivers Assembly Crisis, Breaks Silence On Conflicting Court Judgements
- Masiaka and Rogbere Junction Youths Hail Ady Macauley as Future President
- Notice To All Nigerian Youth: How To Apply For The Nigeria Youth Investment Fund
- Tax Break For Low Income Earners: Nigerians Earning Below N1 Million Exempted From Income Tax
- FG Launches New HND Programs in AI, Cybersecurity, and Software Engineering to Meet Global Tech Demands
- Stakeholders Ought to Project Nigerian Sports in Positive Light – NSC DG Bukola Olopade
- IG Orders Arrest Of Cops’ Killers During Abuja Shi’ite Procession
- Court of Appeal Upholds IPOB’s Terrorist Status – What This Means for Nnamdi Kanu
- Osinachi’s Husband Sentenced to Death by Hanging
- Nigeria Declares Bitcoin & Other Virtual Assets as Official Securities in Bold New Law
- National Sports Commission Convenes Strategic Meeting With Sports Federations’ Presidents and Secretaries
- CPC Bloc Reaffirms Commitment to APC
- JAMB Raises Bar for Under-16 Admission as 599 Gifted Candidates Score Above 320 in UTME
- Shettima Vows Federal Backing for Nigerian Investors: A Billion-Dollar Economy in Sight
- PRESIDENT TINUBU’S MINING REFORMS YIELD SIX-FOLD INCREASE IN REVENUE, $800M FOREIGN INVESTMENT, REVEALS ALAKE
- Apple honors eight developers with annual Apple Design Awards


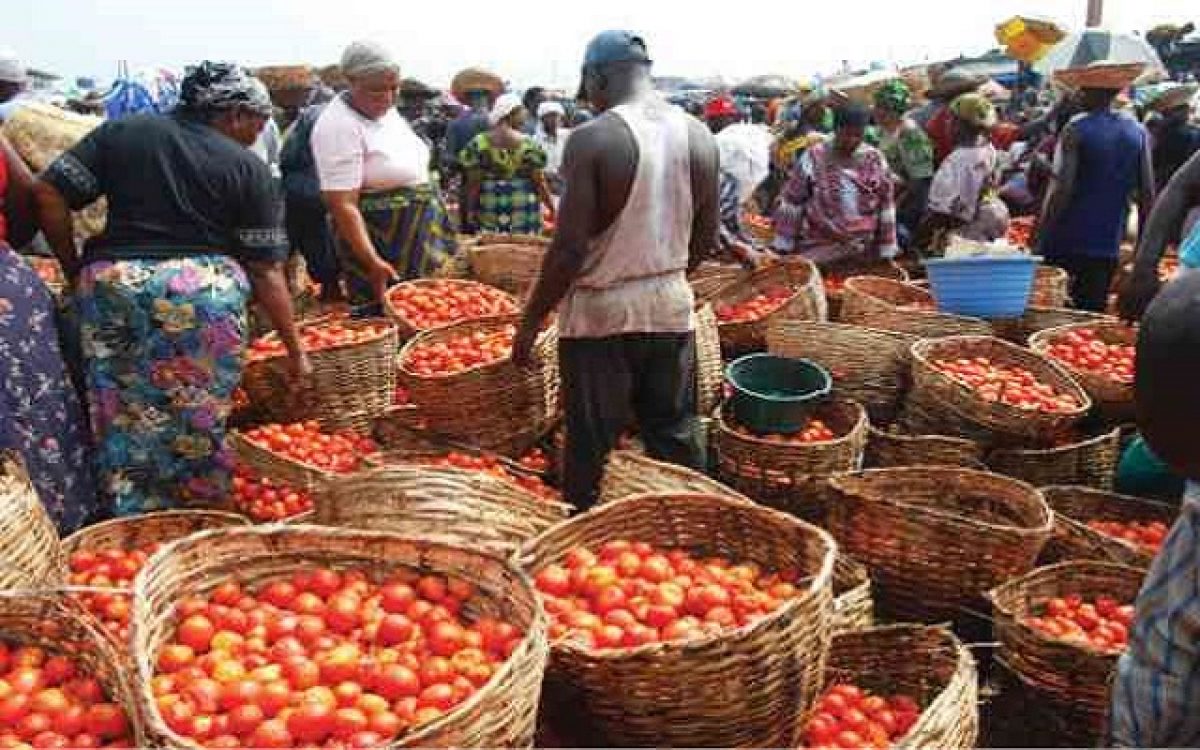
When a triangle pattern forms alongside a strong breakout candlestick, it often signals strong buying pressure behind the move, increasing the likelihood of a sustained upward trend.
However, if the breakout appears weak or is accompanied by a small candlestick, it may indicate a false breakout or temporary pullback. In such cases, traders are advised to combine chart patterns with additional tools before making trading decisions.
Enhancing decisions with momentum indicators
Beyond candlesticks and trend lines, traders often combine triangle patterns with momentum indicators such as the Relative Strength Index (RSI) and the Moving Average Convergence Divergence (MACD) to assess the strength and direction of price movements.
A confirmed breakout supported by strong momentum readings increases confidence in the validity of the signal. Conversely, weak or conflicting indicators suggest caution and may warrant waiting before entering a trade.
READ ALSO: Kola Daniel Joins 2027 Africa School Games LOC
By combining classical chart pattern analysis with price action strength, traders develop a more comprehensive framework for decision-making. Market professionals emphasize the importance of using multiple analytical tools rather than relying on a single signal when assessing risk and opportunity.
Real-world application
In practical scenarios, an ascending triangle may form when a stock trades within a stable support level while recording progressively higher highs over several weeks.
A breakout above the upper boundary of the triangle, particularly when supported by increased trading volume, may signal the beginning of an upward trend and present a potential buying opportunity. Similar principles apply across currency and commodities markets, making triangle patterns a versatile tool in technical analysis.
Challenges in identifying patterns
Despite their usefulness, triangle patterns can present challenges. One common issue is the false breakout, where price temporarily moves beyond the triangle boundary before returning to its previous range. This can mislead traders into premature entries.
False breakouts are especially common in volatile markets or following major economic announcements. In some cases, incomplete or unclear formations make it difficult to identify valid triangle patterns, reinforcing the need for caution.
Improving accuracy with additional tools
To reduce the risk of misinterpretation, analysts recommend confirming triangle breakouts with indicators such as trading volume, momentum oscillators, and moving averages.
Understanding the broader market trend whether bullish or bearish also helps traders align their positions with prevailing conditions and avoid impulsive decisions.
By integrating multiple analytical approaches, traders transform triangle patterns from simple chart formations into structured, knowledge-based strategies aimed at achieving consistent and sustainable results.
Summary
Triangle patterns remain a widely used technical analysis tool for anticipating potential price movements.
Recognizing the different types of triangles, monitoring support and resistance levels, incorporating complementary indicators, and applying disciplined risk management strategies can help traders build a more resilient and predictive trading framework.


Search
Recent Post

Torreira Rates Osimhen Top as Butt Urges
- March 30, 2026
- 3 min read

Zenke Hails Nigerian Debutants After Super Eagles’
- March 30, 2026
- 2 min read

Eagles Cap Thrills Fernandez Following Nigeria Debut
- March 30, 2026
- 2 min read
Featured Videos
All Tags
Abeokuta
Ademola Lookman
AFCON
Aliko Dangote
Anthony Joshua
APC
Army
Barr. Caleb Manasseh Mutfwang
CBN
Court
D'Tigress
EFCC
Eid-el-Fitr
FIFA
First Lady
Gov. Hope Uzodimma
Governor Hope Uzodimma
INEC
inflation
Kebbi
Lagos
NAFDAC
naira
National Sports Commission
NDLEA
NGX
Nigeria
NNPCL
NPFL
NSC
Nyesom Wike
Oil
PDP
Peter Obi
Police
President Bola Ahmed Tinubu
President Bola Tinubu
Senator Oluremi Tinubu
sports
Sunday Dare
Super Eagles
Taiwo Oyedele
Tax
Vice President Kashim Shettima
Victor Osimhen